News
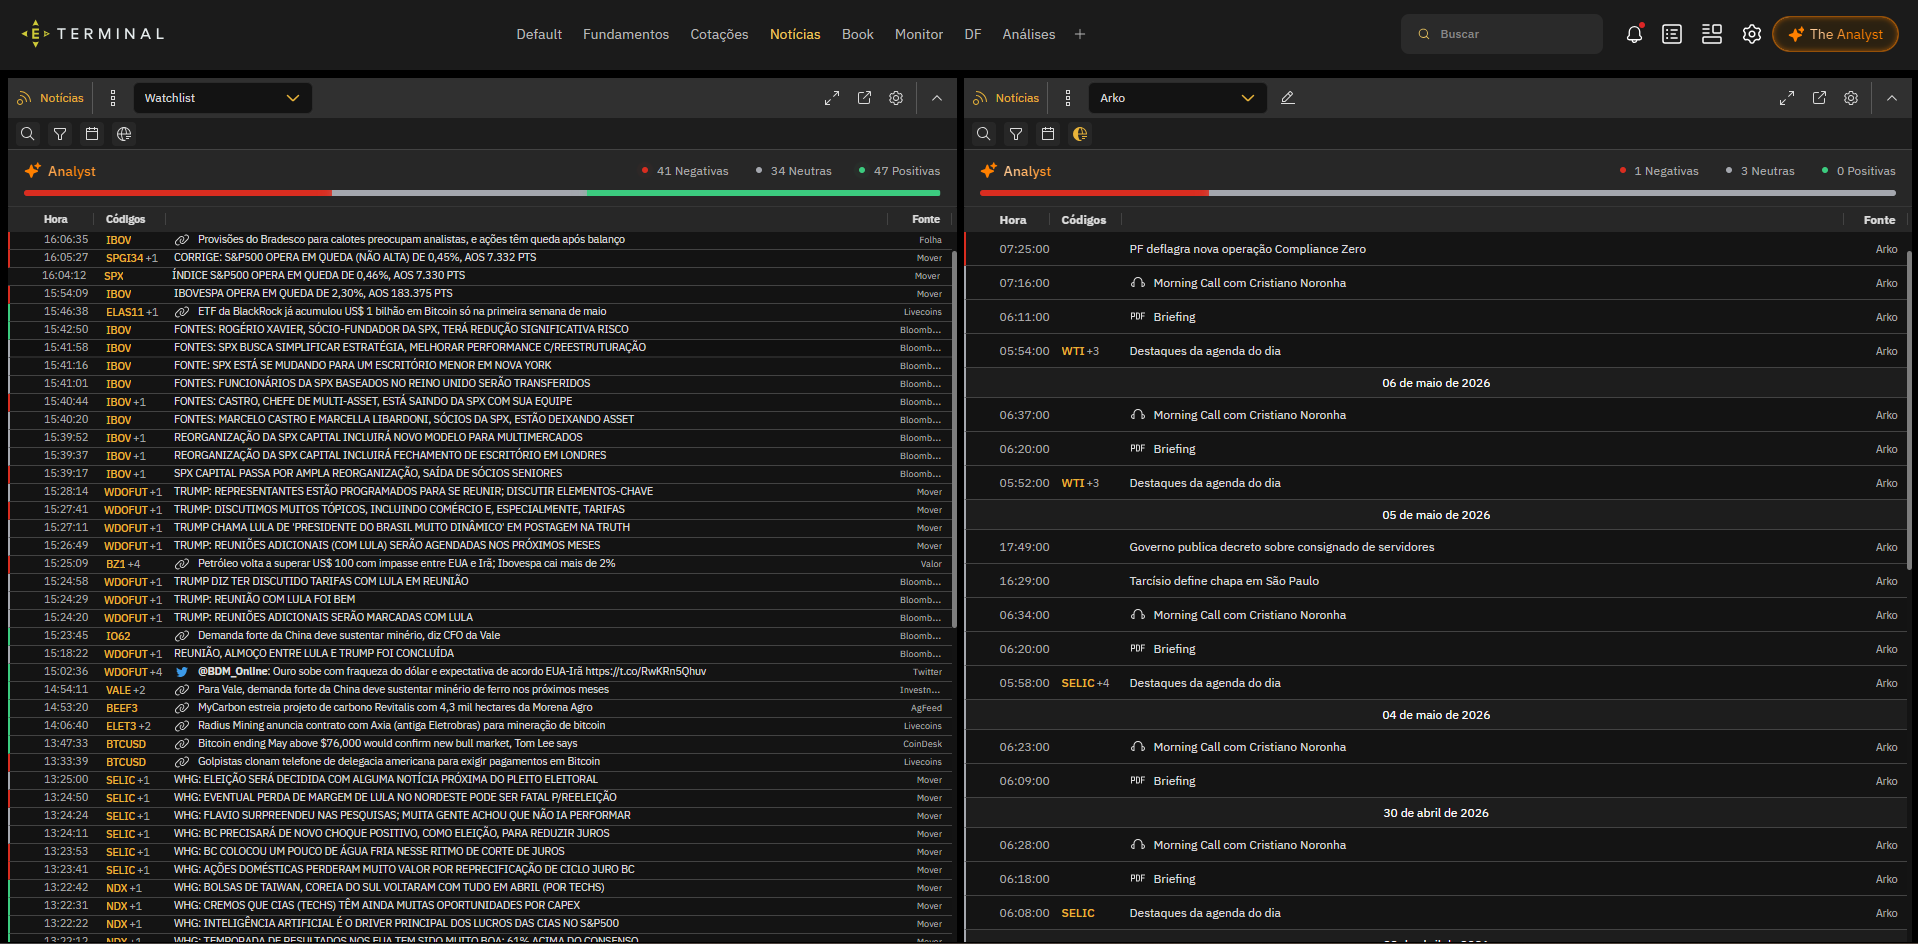
Centralize market news, proprietary sources, and aggregators, with filters by asset and sentiment classification to support reading news and relevant events.
Market newsSentimentFilter by asset
Real-time market data*, news, analysis, and The Analyst, an AI feature connected to the Economatica database to contextualize assets and support news reading, subject to availability, all in a single environment.
* Real-time data availability subject to the contracted license and data source.
The Terminal is the most recent consumption and navigation layer for the Economatica database, with AI features embedded in the Terminal's analysis flow. It combines market data, editorial content, analytical tools, and The Analyst, the AI copilot connected to the Economatica database that generates asset context and reads news sentiment.
Connected modules covering market monitoring, asset investigation, and access to structured data. Designed for analysts, trading desks, and operations that work with Economatica as a data core.
Centralize market news, proprietary sources, and aggregators, with filters by asset and sentiment classification to support reading news and relevant events.
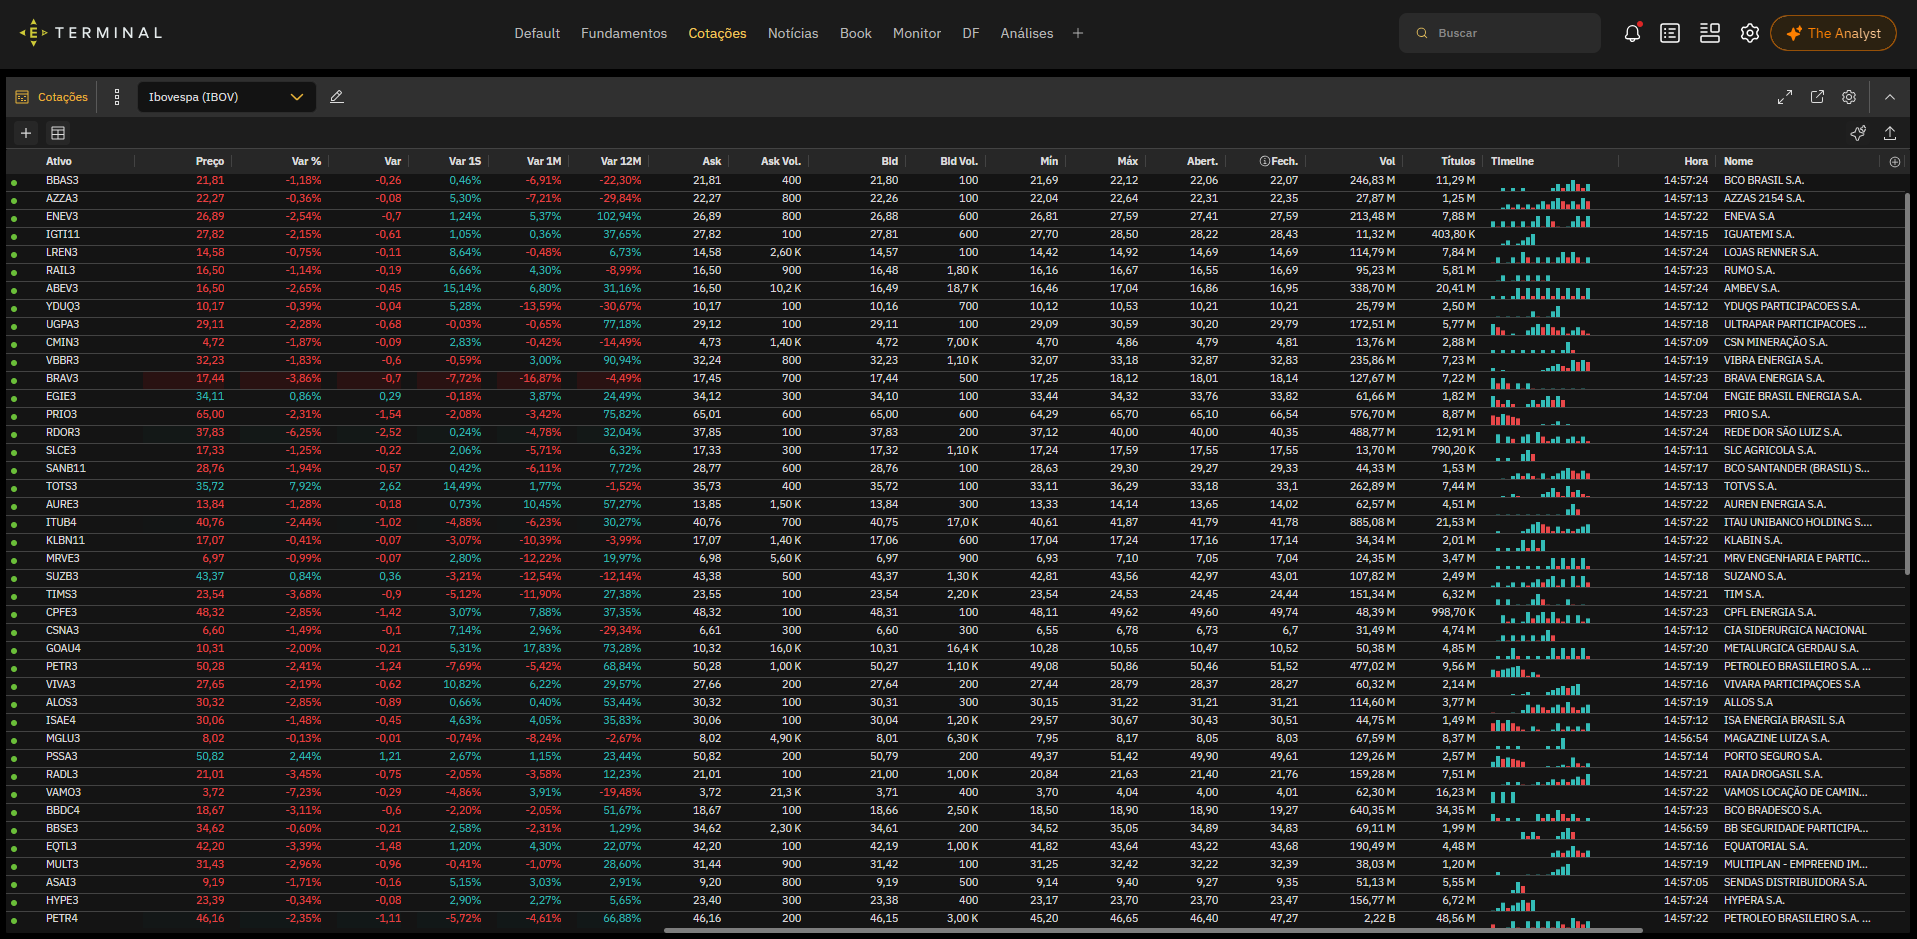
Monitor assets with intraday or real-time data, according to license and contracted source, with prices, changes, volumes, bid/ask, and mini charts to quickly compare stocks, ETFs, indices, and other instruments.
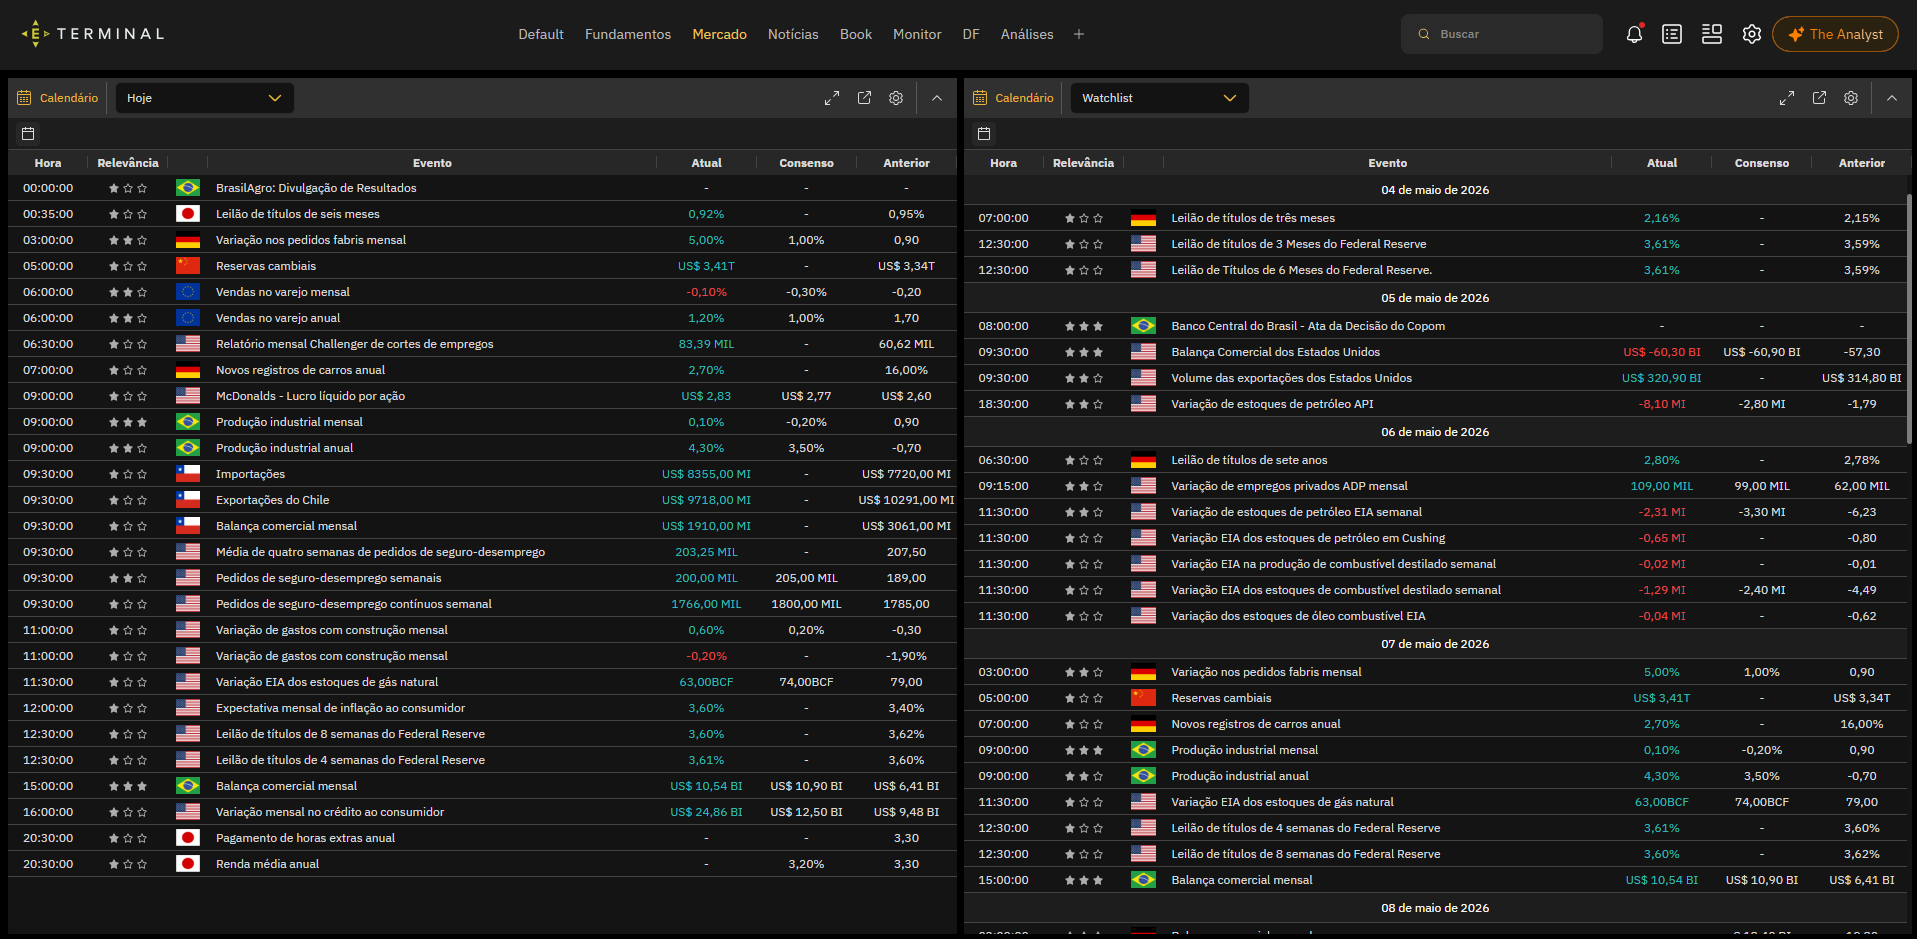
Follow relevant economic and corporate events, with times, consensus, prior data, and relevance to anticipate impacts on the market and on your watchlist.
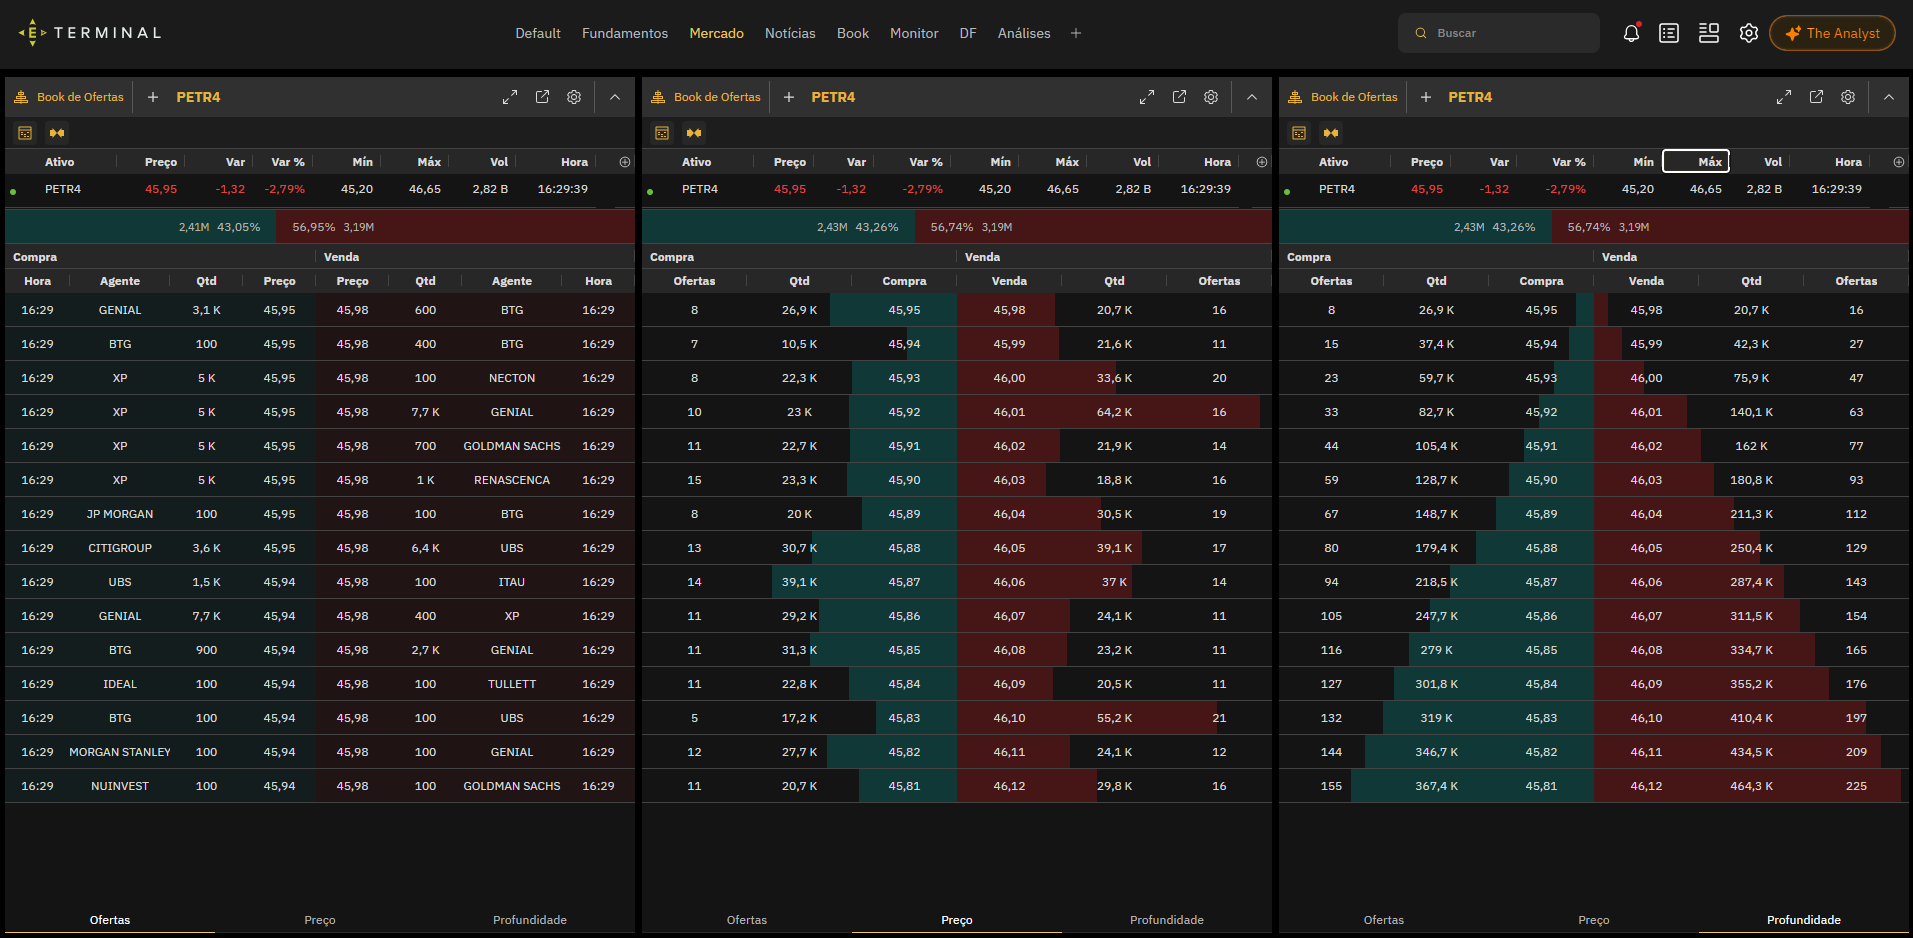
View order levels, prices, quantities, and depth to assess liquidity and book dynamics.
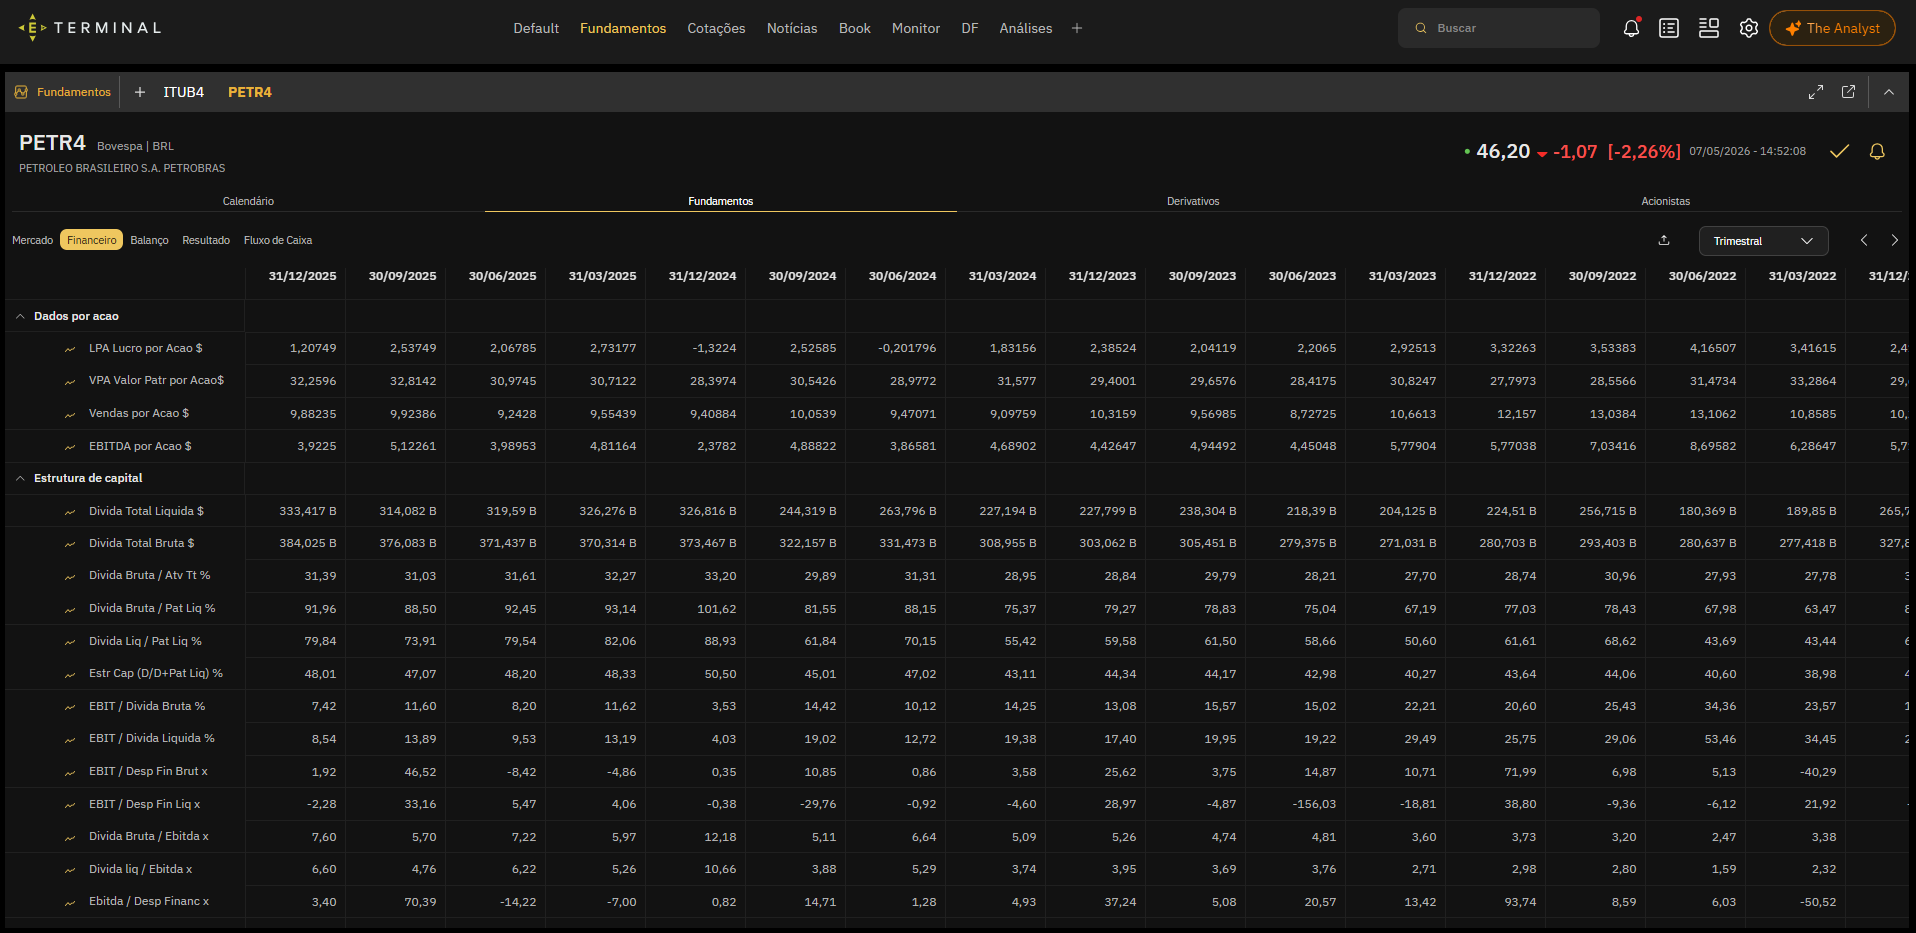
Combine fundamental indicators, per-share data, and capital structure in a dynamic screen to compare companies and track value trends.
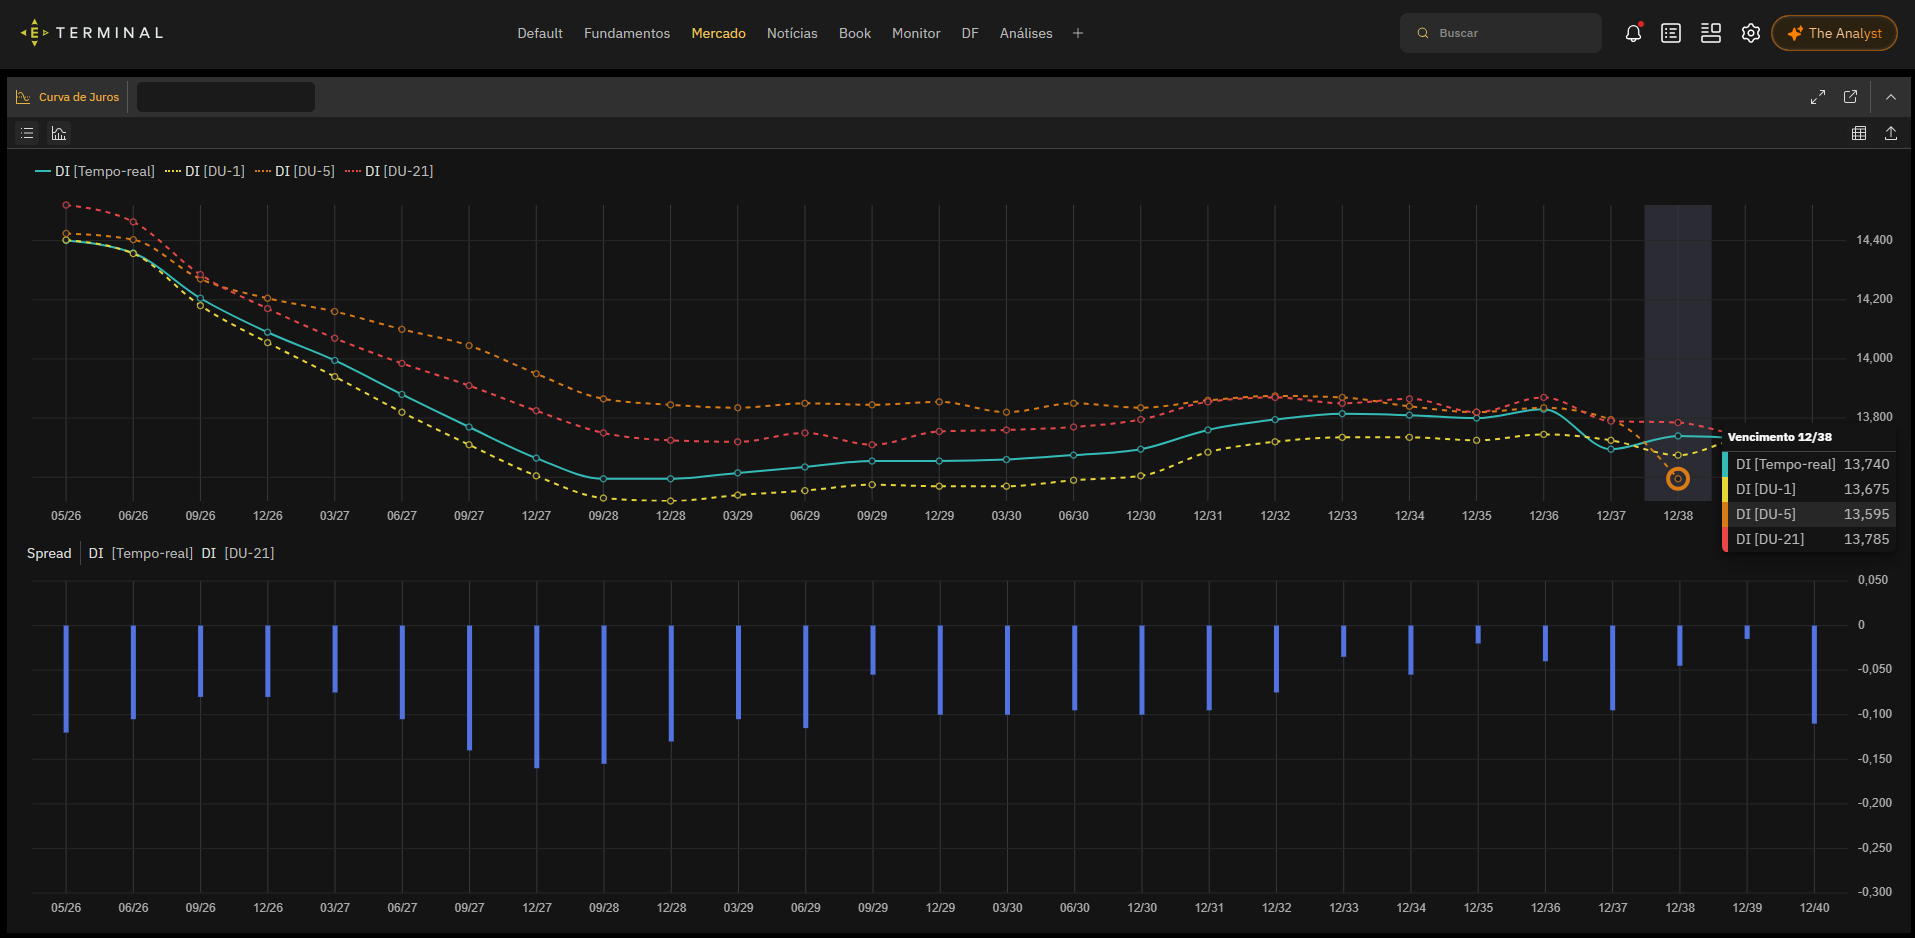
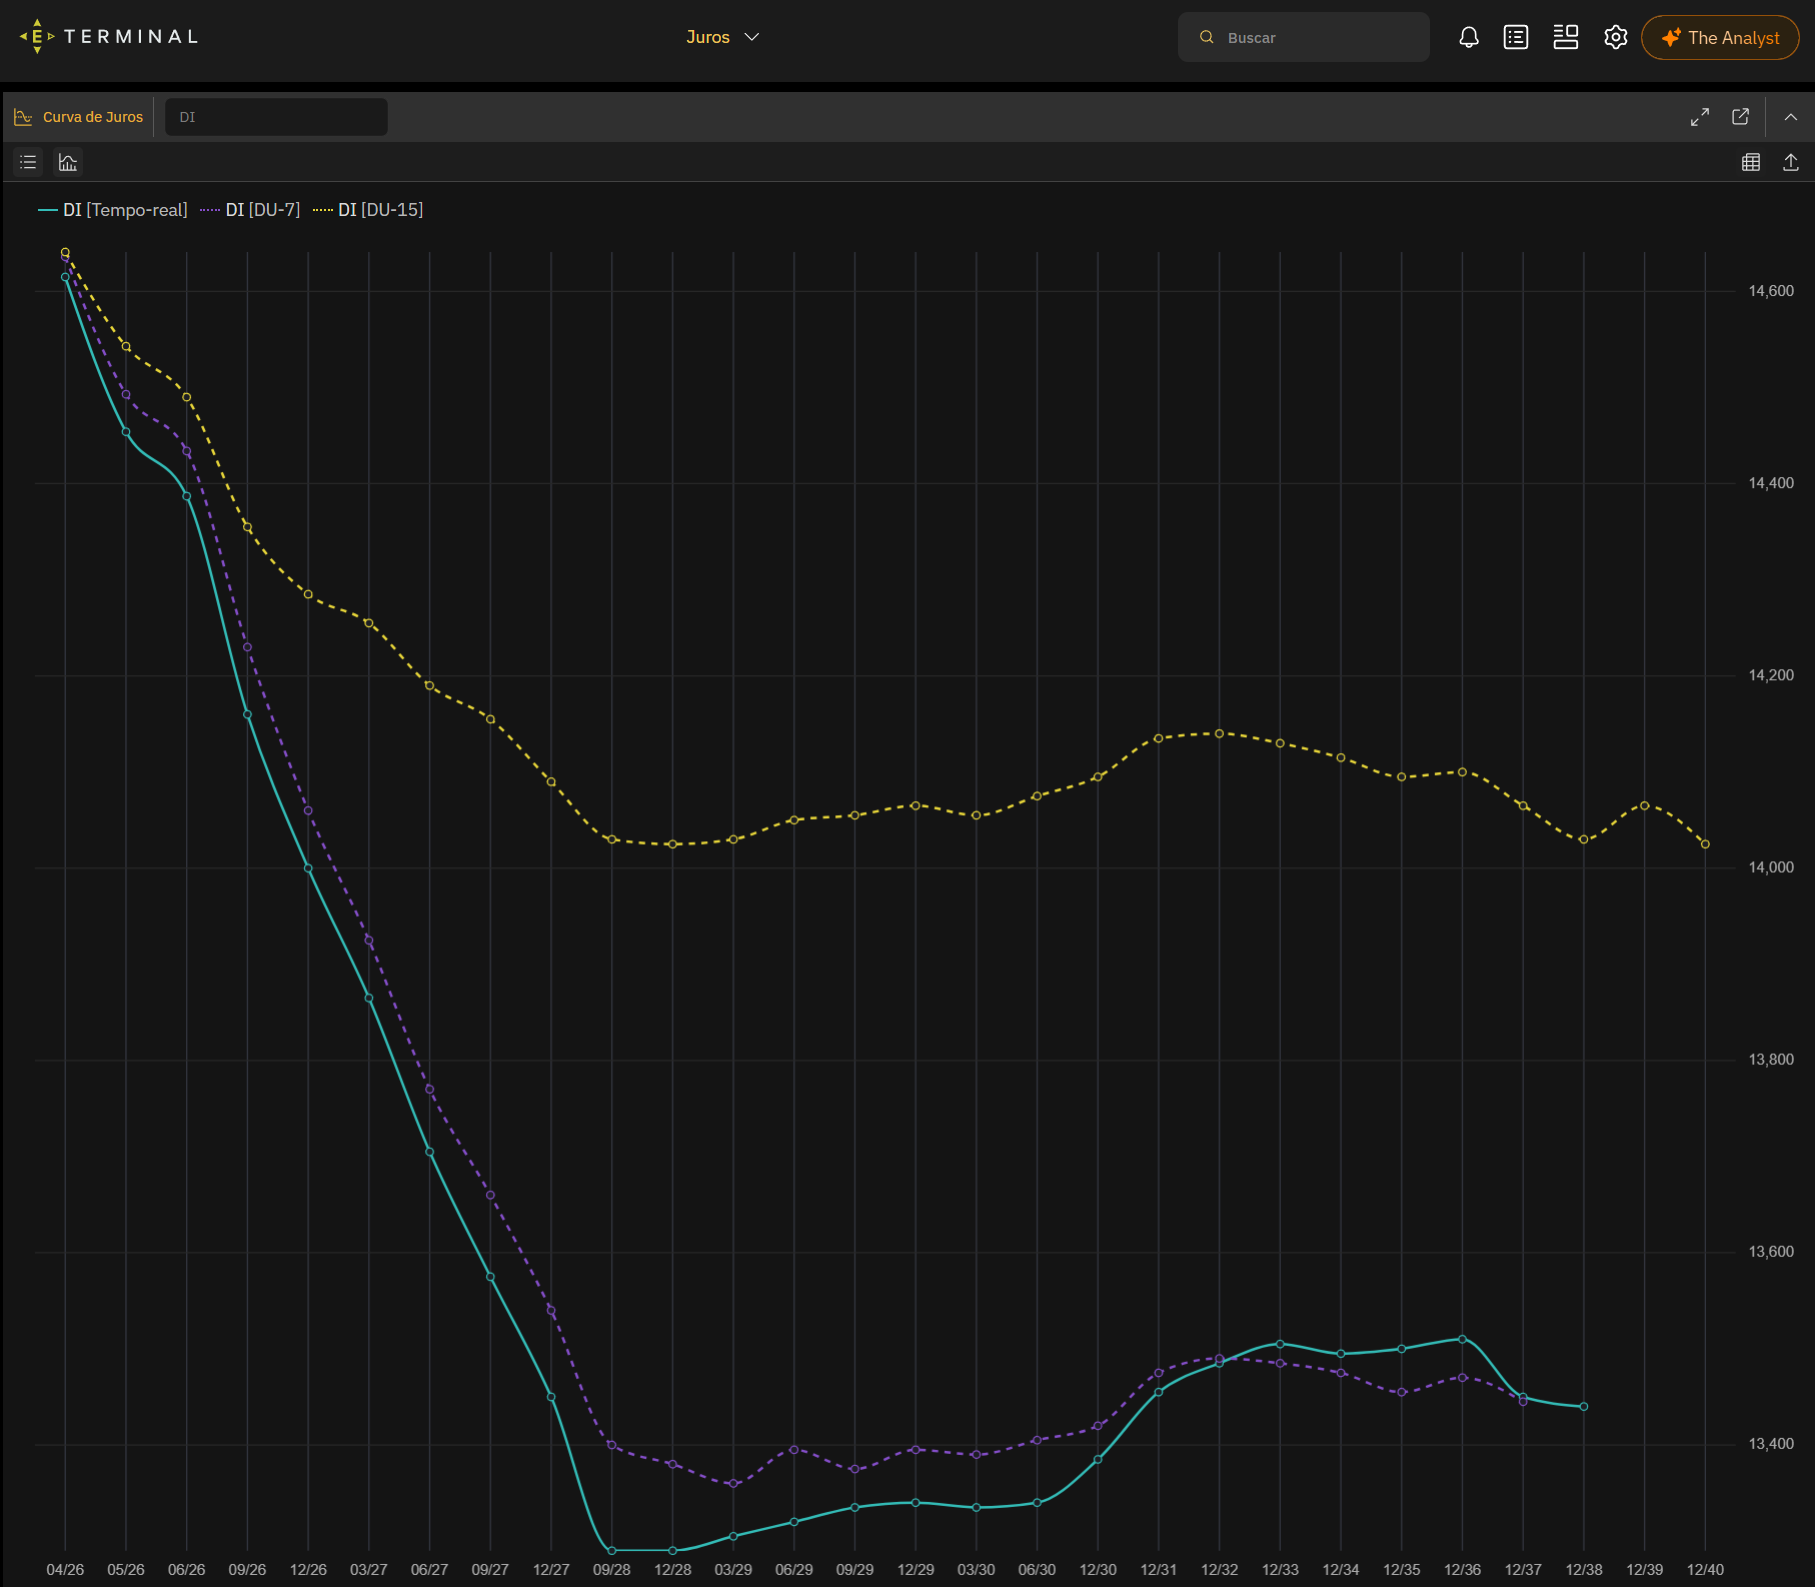
Analyze the DI curve in real time and historically, comparing maturities, spreads, and shifts to support fixed income and macro decisions.
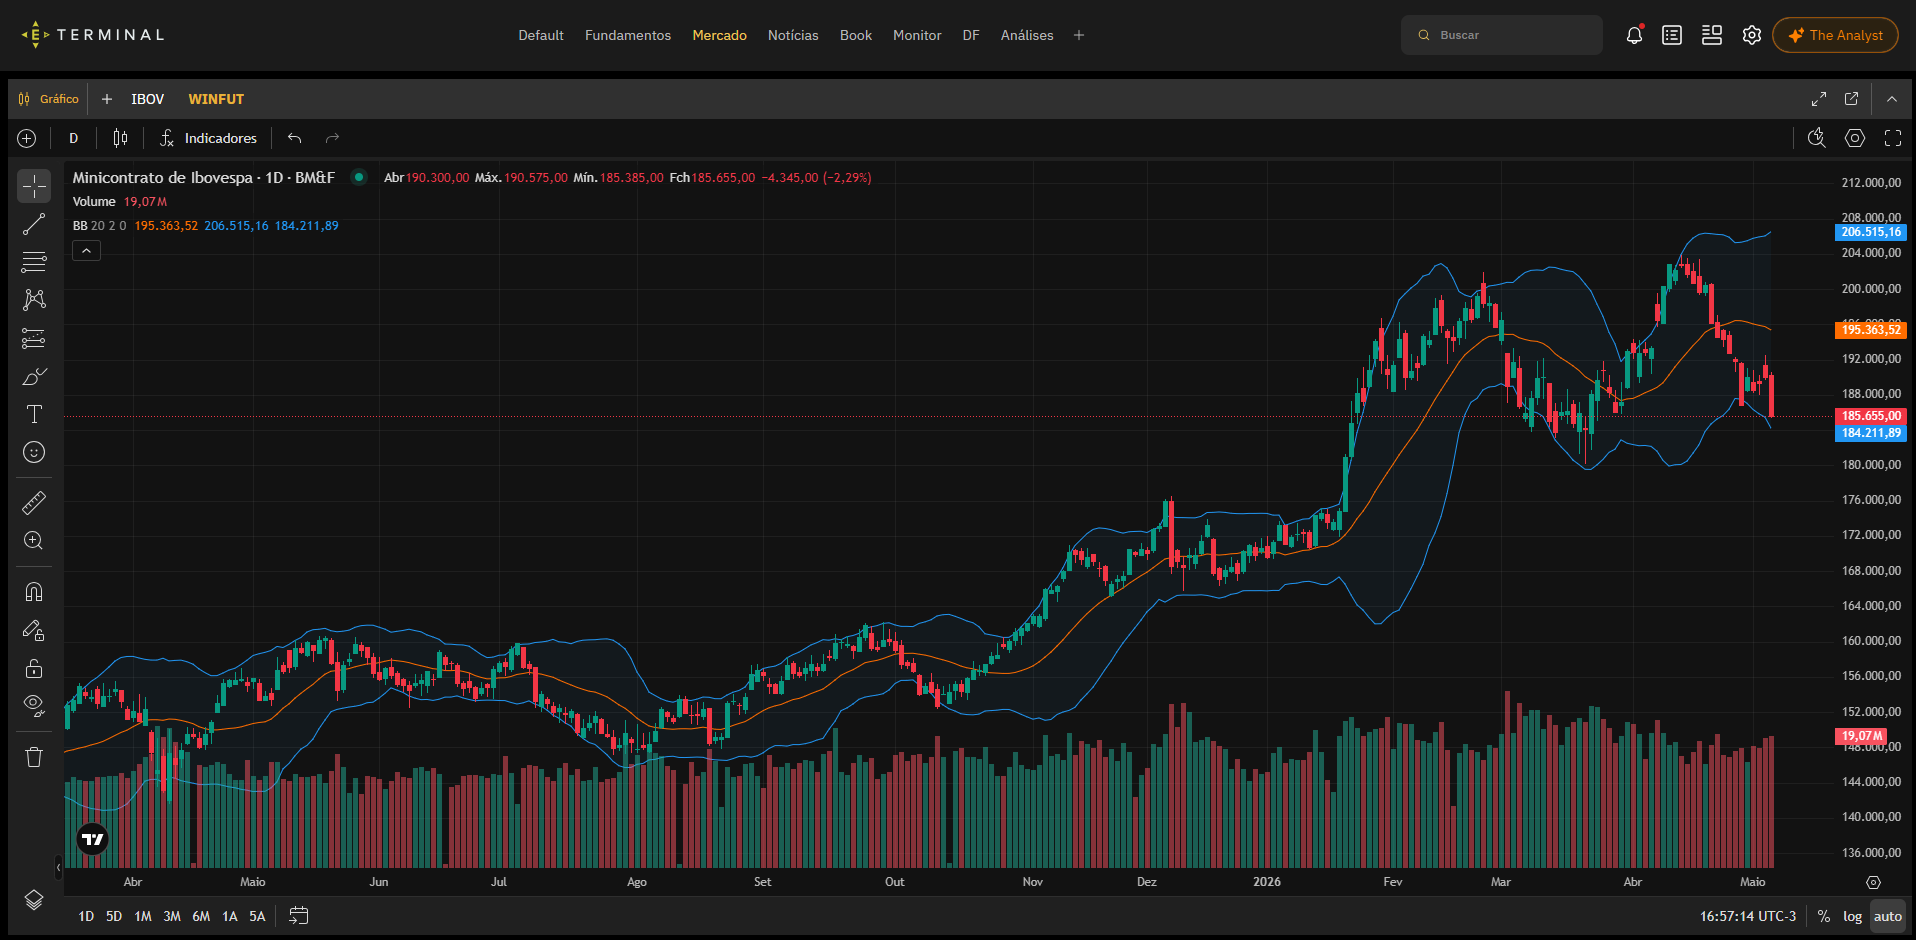
Analyze assets with interactive charts, flexible timeframes, technical indicators, and visual tools to analyze trends, price patterns, and historical/intraday asset behavior.
AI copilot connected to the Economatica database: per-asset context based on the preferences configured in the Terminal, plus sentiment reading on each piece of news.
The Analyst
AI feature available to support market analysis by cross-referencing different information and data quickly. Request a demo to see this feature in action.
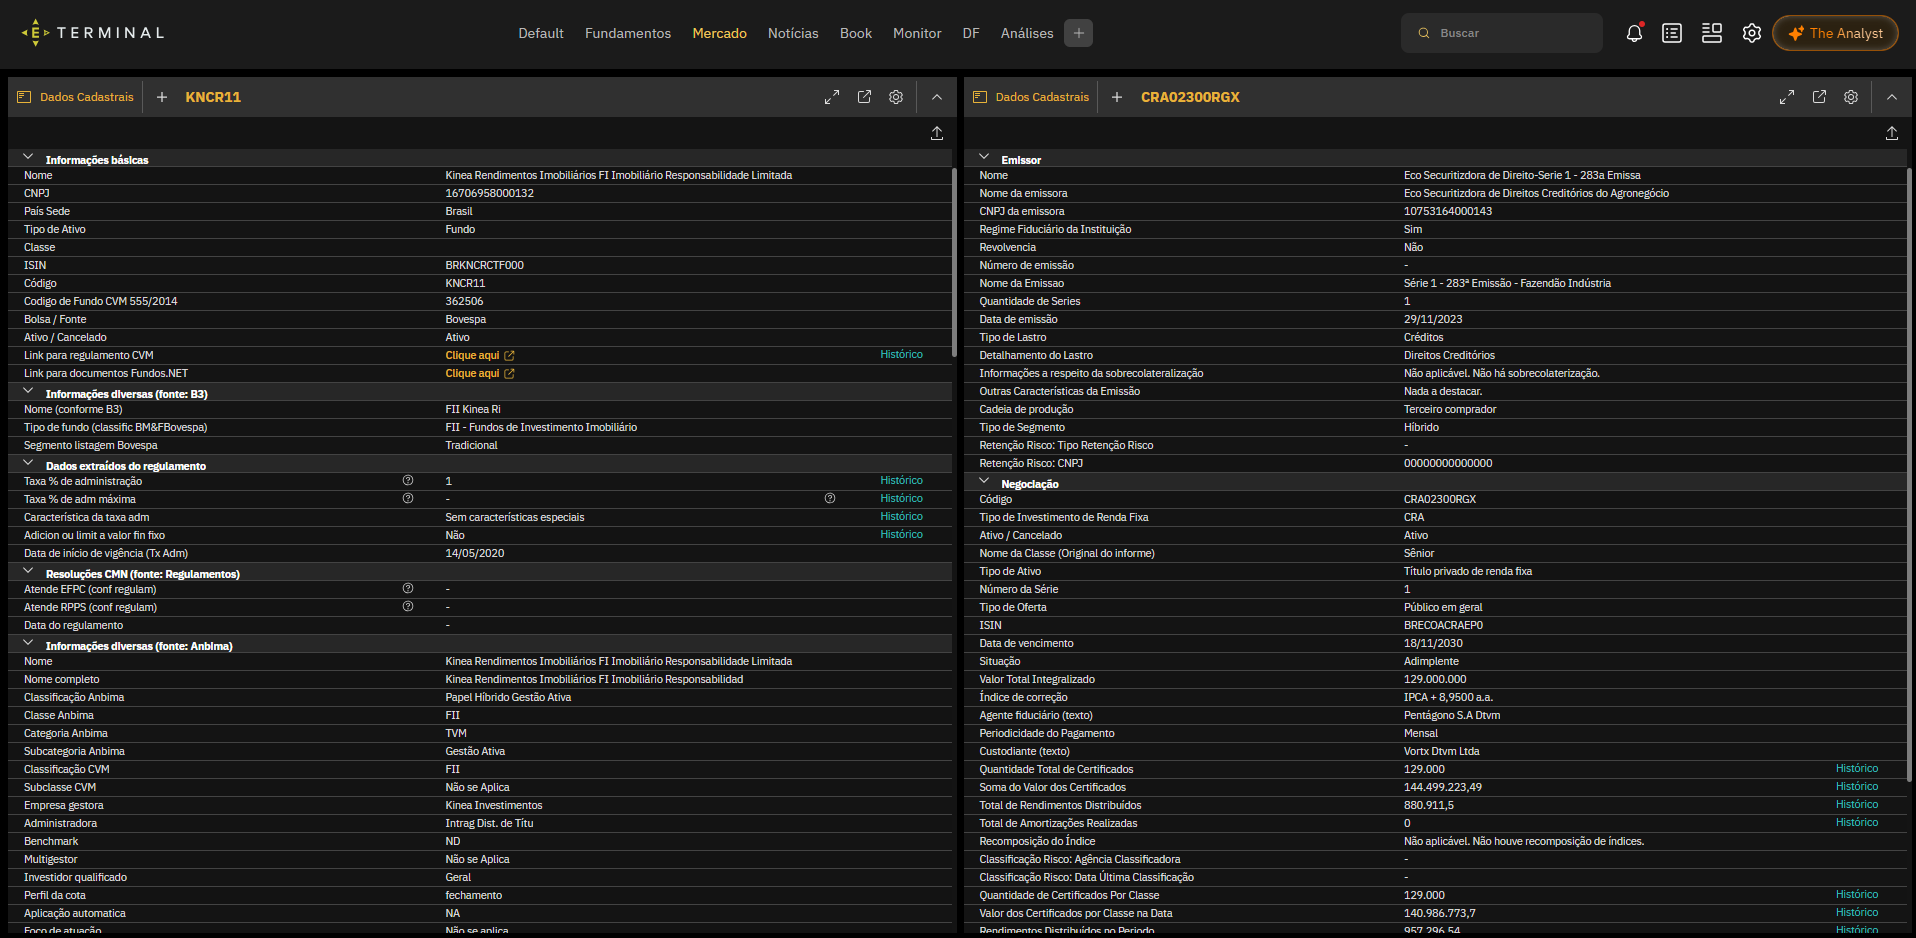
Look up structured information on assets, issuers, and funds, gathering codes, classification, source, regulations, and essential characteristics in a single view.
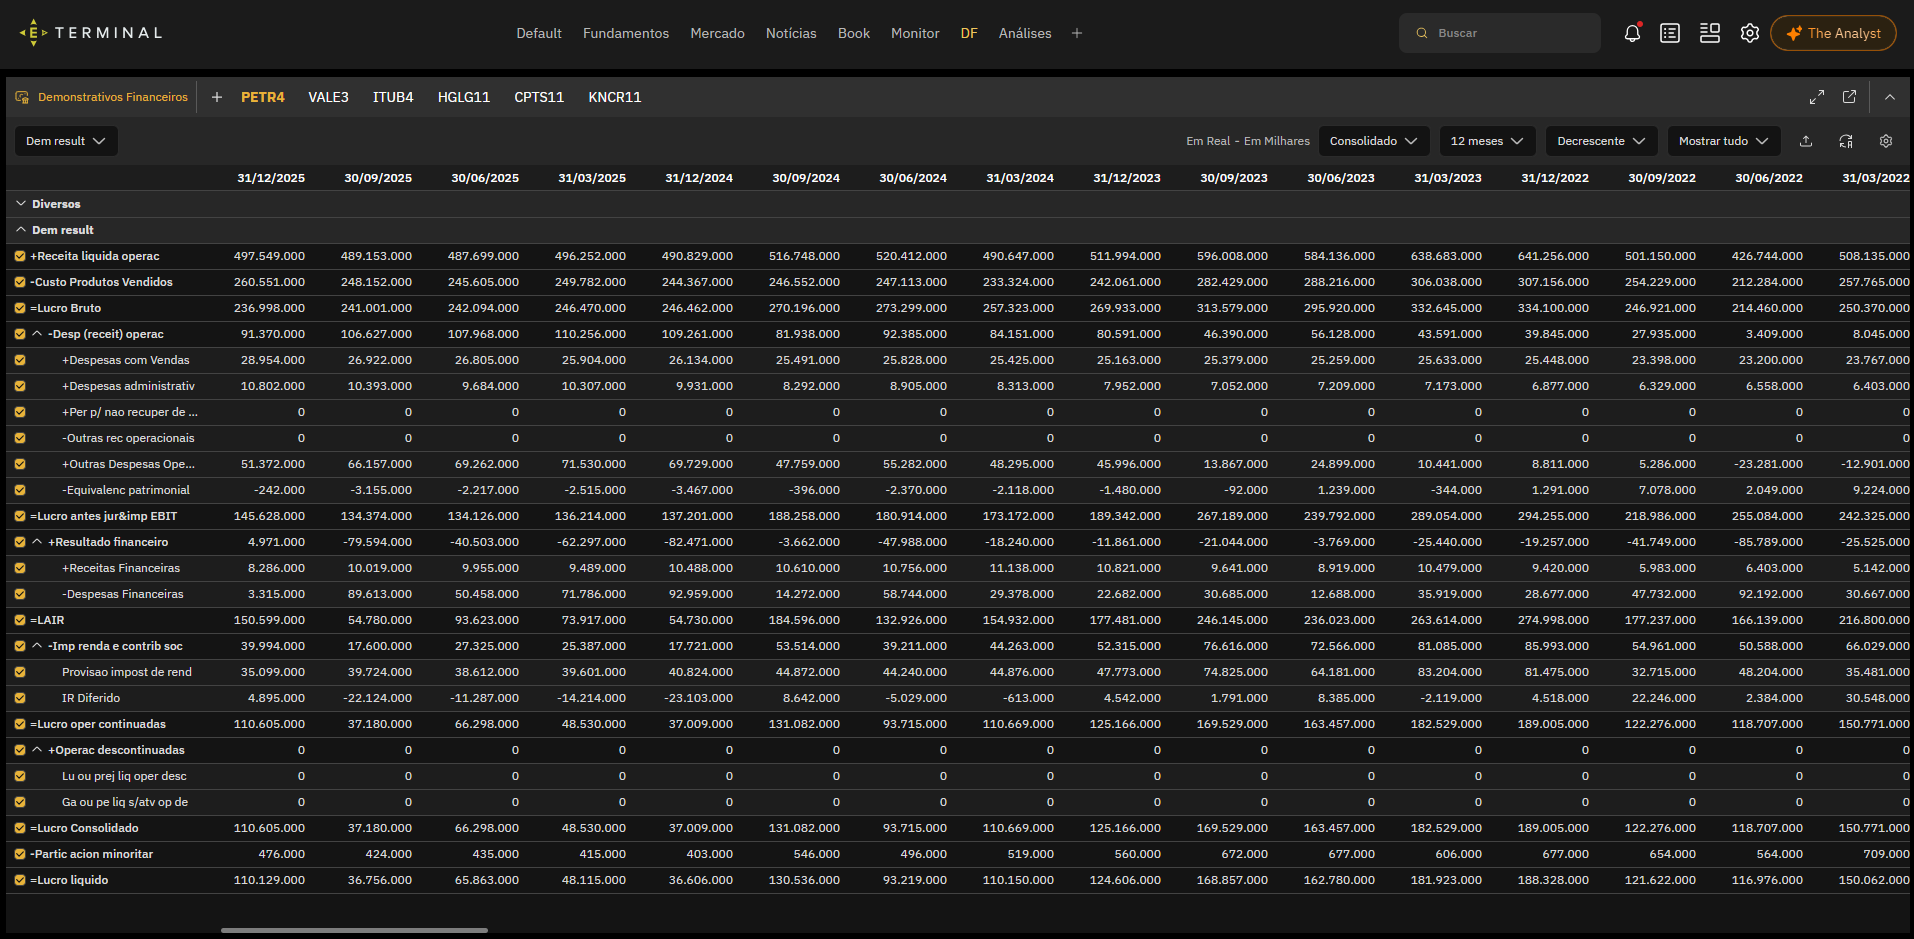
Access standardized financial statements, with comparable periods and display filters, making it easier to analyze results, margins, debt, profit, and historical evolution.
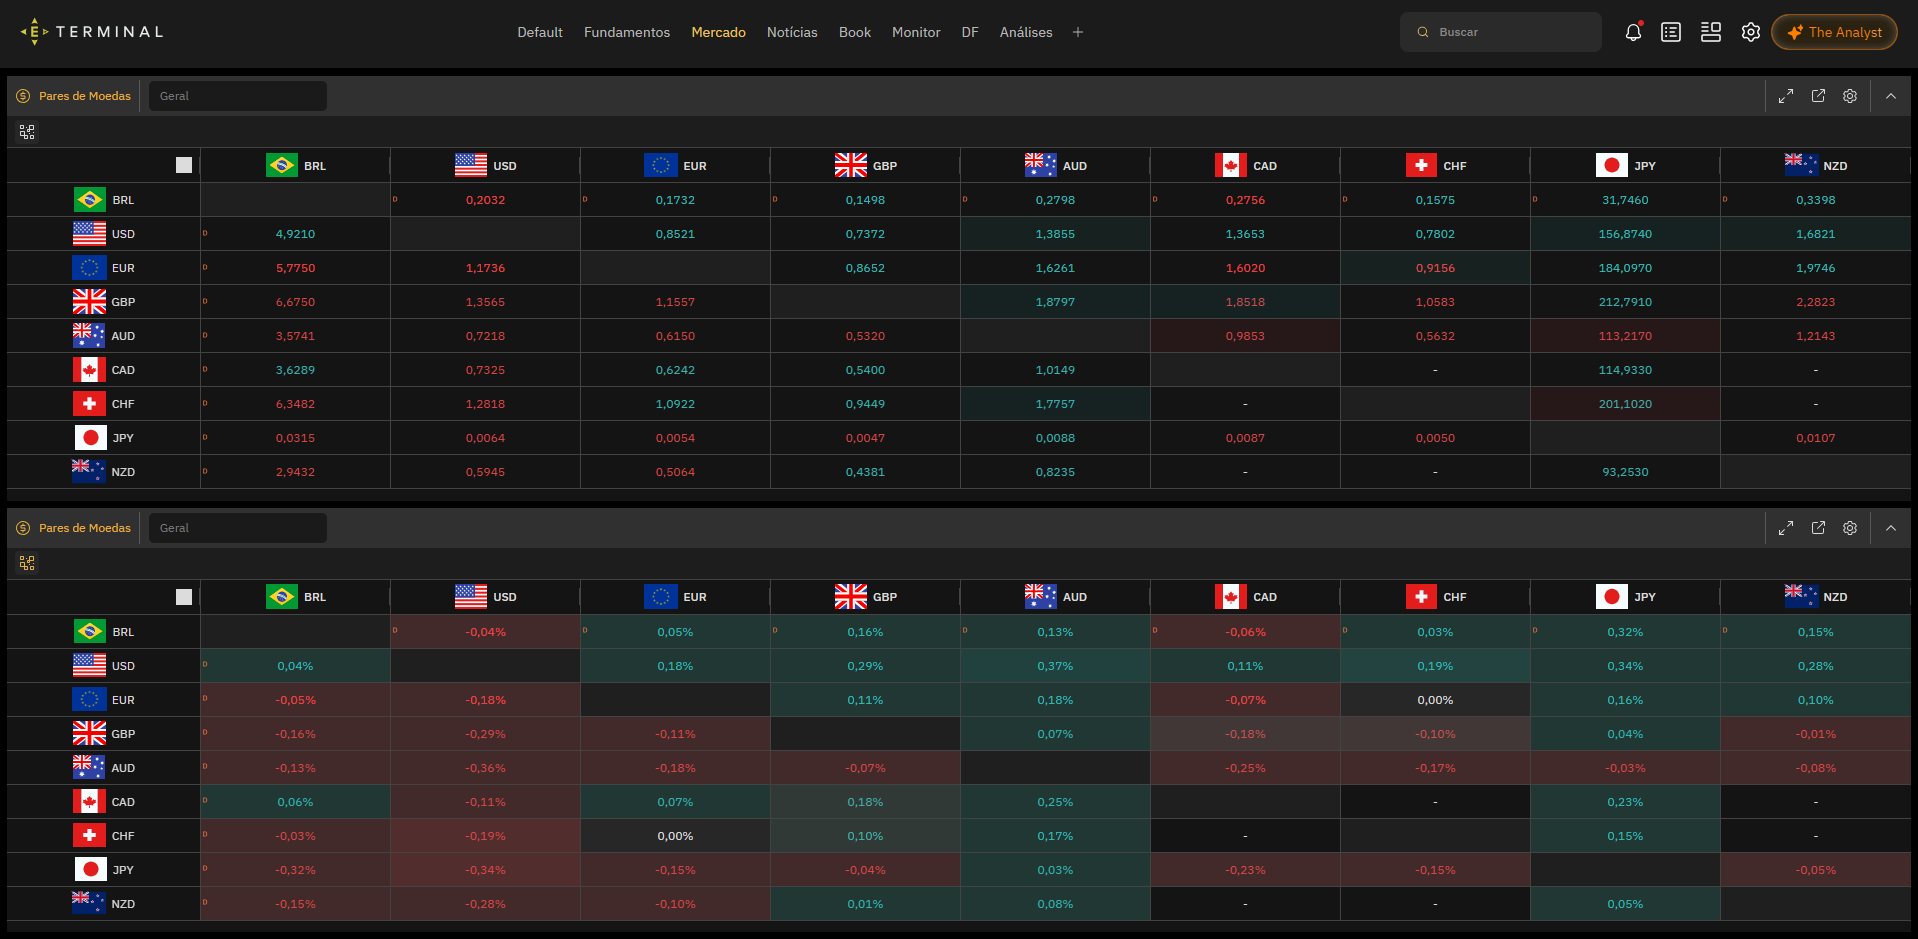
Track quotes and changes of the main currency pairs in a visual matrix, quickly identifying relative movements between the local FX and global currencies.
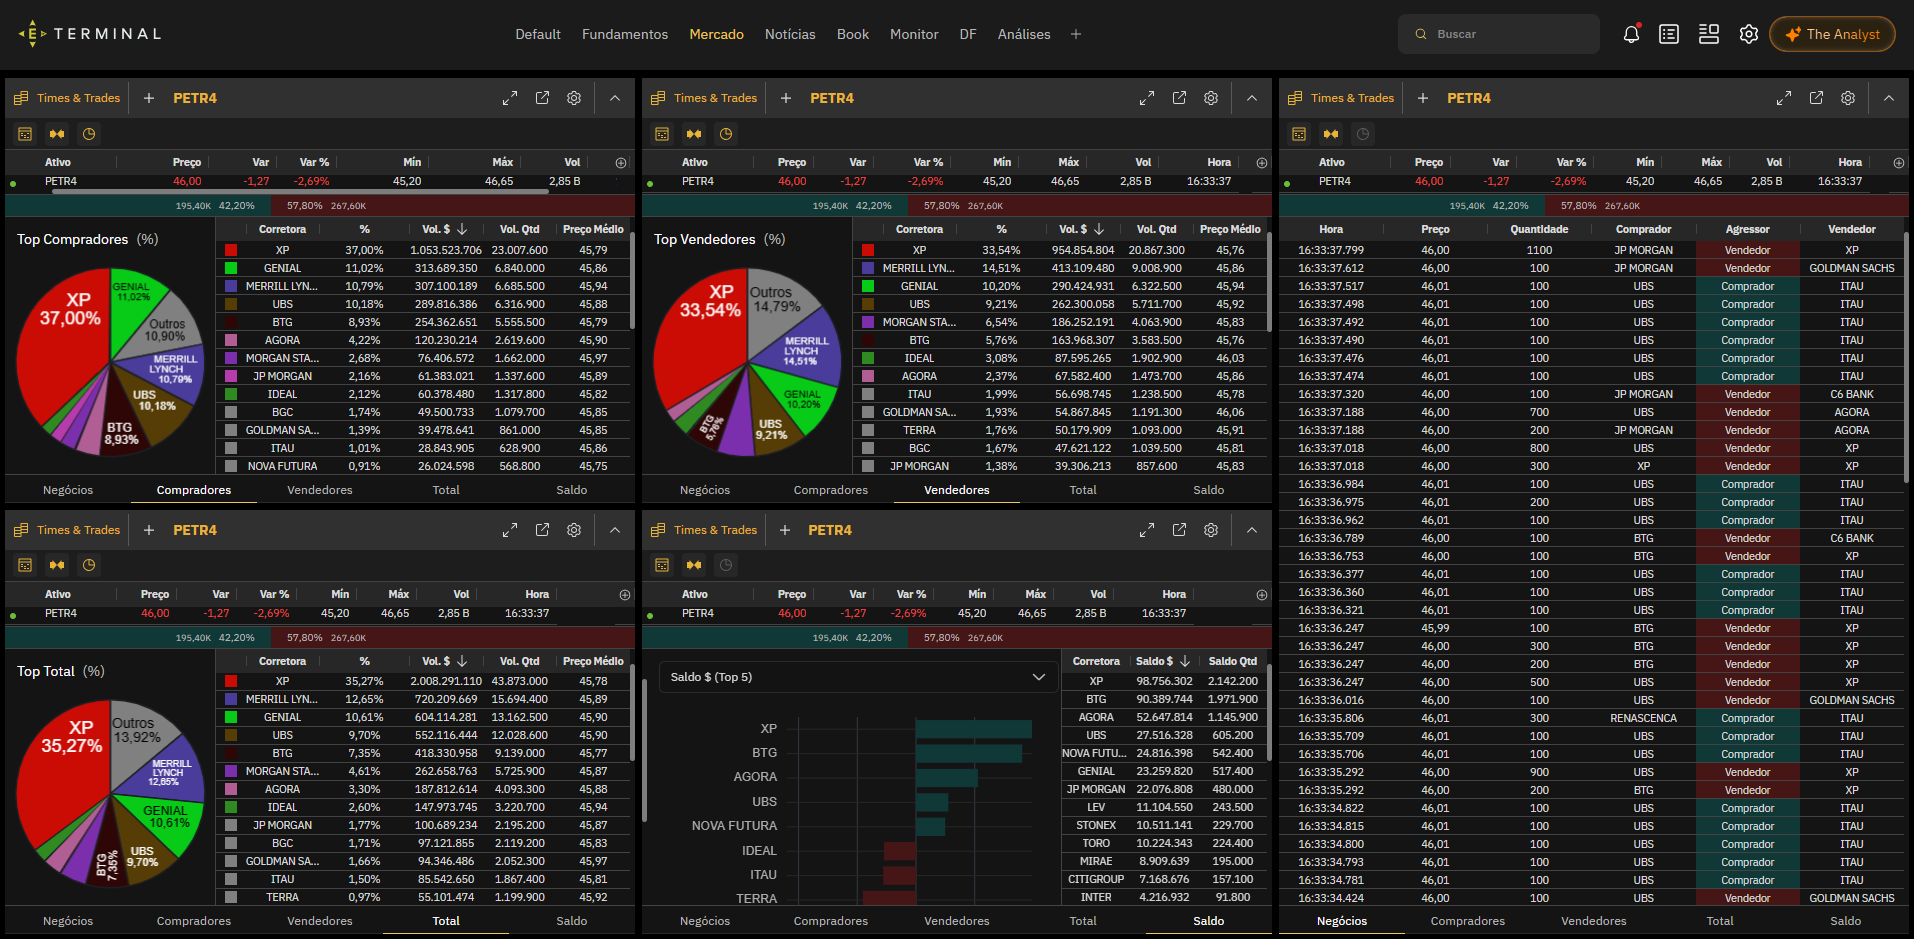
Follow trades in real time, main buyers and sellers, aggressors, balance, and participation by broker to understand intraday flow.
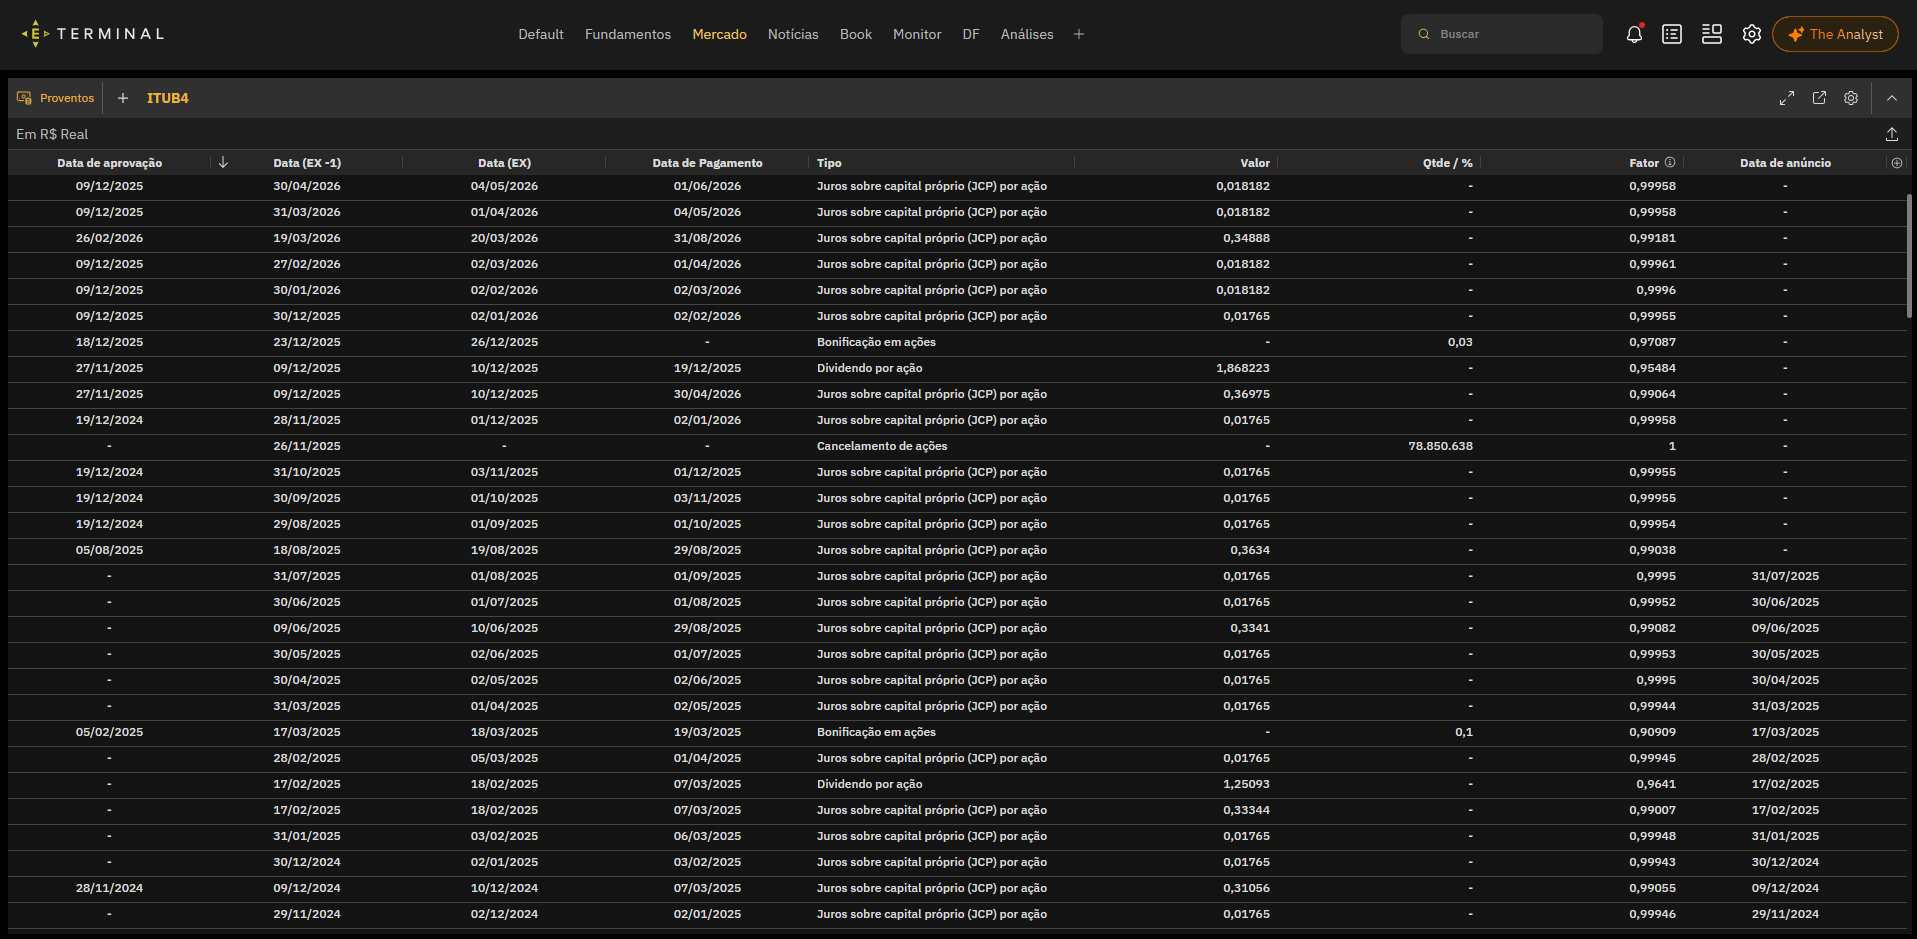
Look up dividends, interest on equity, bonuses, and corporate events, with key dates, values, and factors to track impacts on assets.
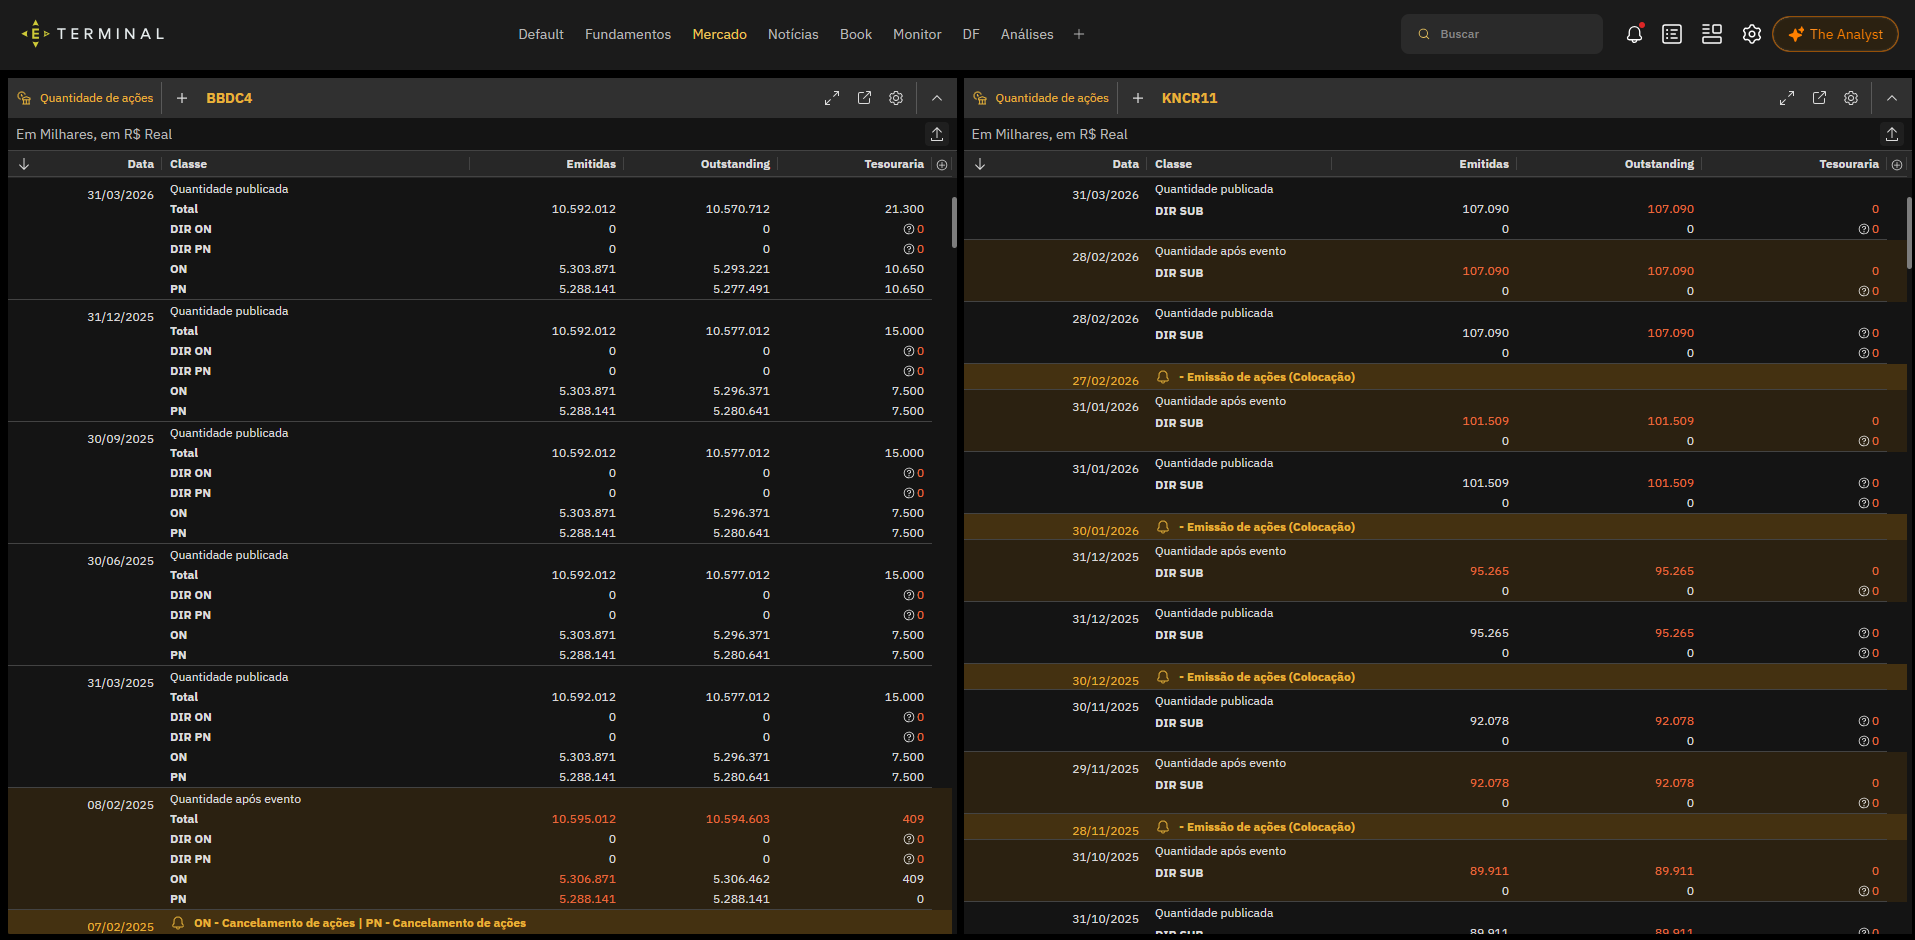
Monitor changes in share count, issuance, cancellation, and treasury events, understanding their effects on capital, liquidity, and per-share indicators.
An AI copilot connected to the Economatica database that reads news sentiment and contextualizes assets based on the preferences configured in the Terminal (watchlists, favorite assets, filters).
The Analyst takes into account the preferences configured in the Terminal (watchlists, favorite assets, filters) to explain price moves, highlight risks, and suggest correlated assets. Everything grounded in proprietary Economatica data.
Each headline is automatically classified as positive, neutral, or negative, with aggregation by asset and by period, for an instant read of market flow.
Answers anchored in the context of the asset you are analyzing (fundamentals, charts, yield curve, dividends), with explicit reference to the Economatica historical series.
Price down 2.1% on volume above the 20-day average. News flow negative over the last 4h.
I attribute the move to the sector's guidance revision and to the Brent adjustment, consistent with the Economatica volatility series since 2024.
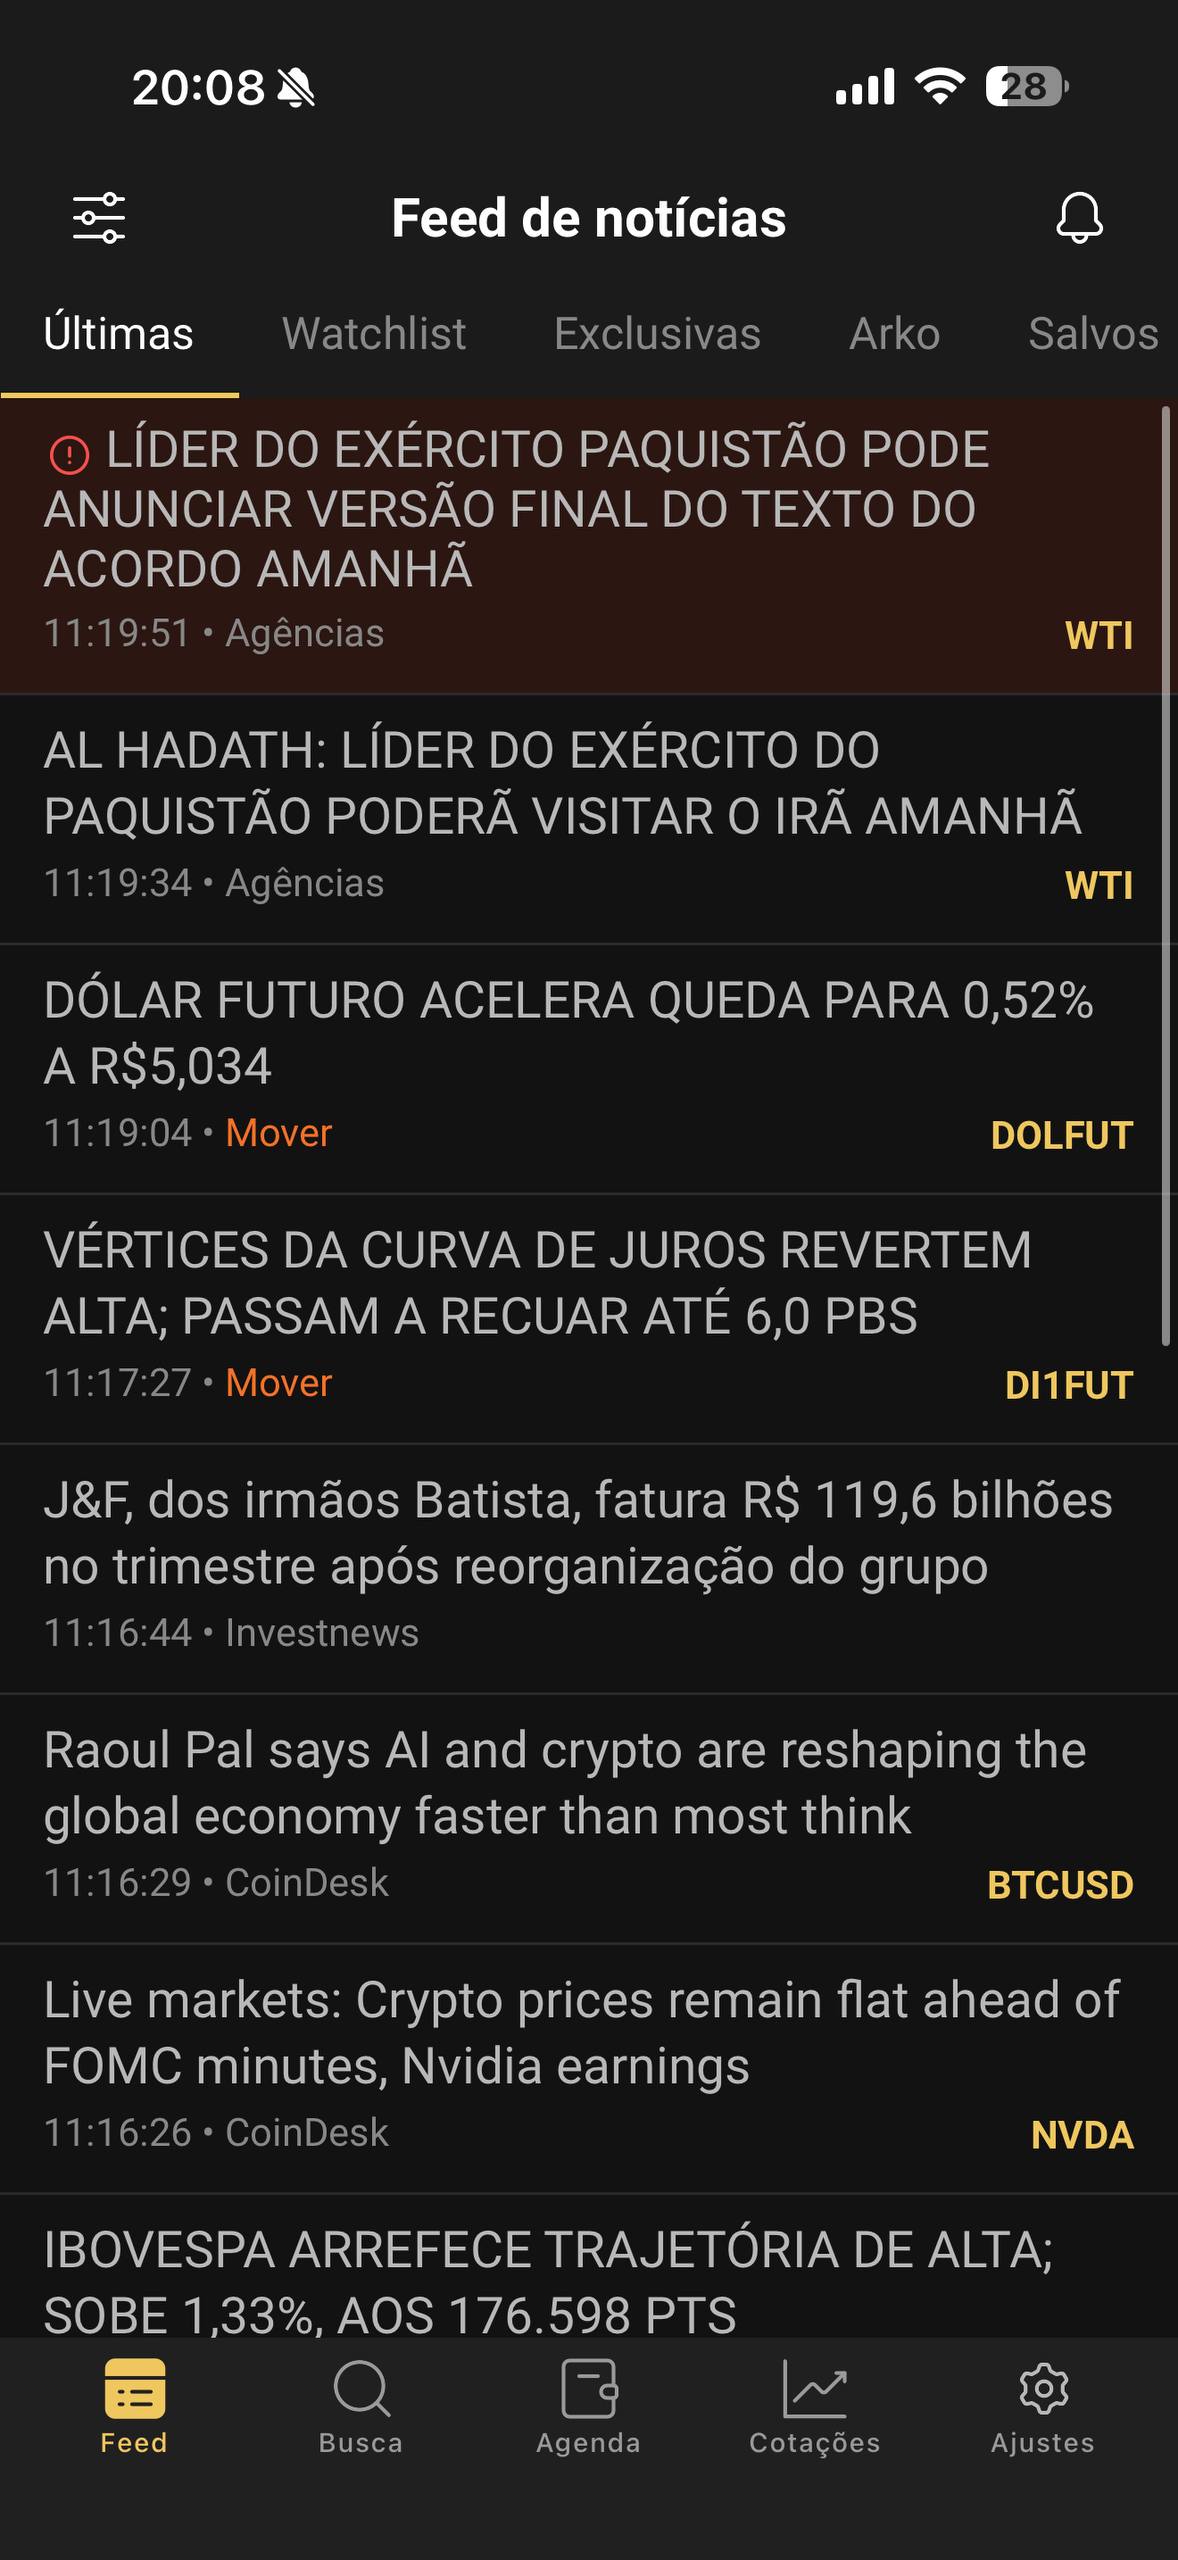
The Economatica Terminal app brings the full news feed, CVM real-time disclosures, live quotes, charts and the economic calendar to your phone, without losing the depth of the desktop.
Breaking news, material facts and CVM real-time disclosures land on your phone in seconds. Configure by asset, topic or relevance.
Watchlist, highs, lows and volume synced with your desktop.
Technical analysis with multiple timeframes and indicators at your fingertips.
Macro indicators, releases and events with advance alerts.
The Terminal connects proprietary data, market data, indicators, editorial content, and analytical tools in a single user journey. It does not replace the Economatica database, it translates it into a more accessible, navigable experience tied to the daily routine of the market.
The Terminal was designed for the profiles that treat data as the main raw material of their decision-making.
Schedule a demo and see the Terminal, plus The Analyst copilot, connected to your operation.
Choose where to log in