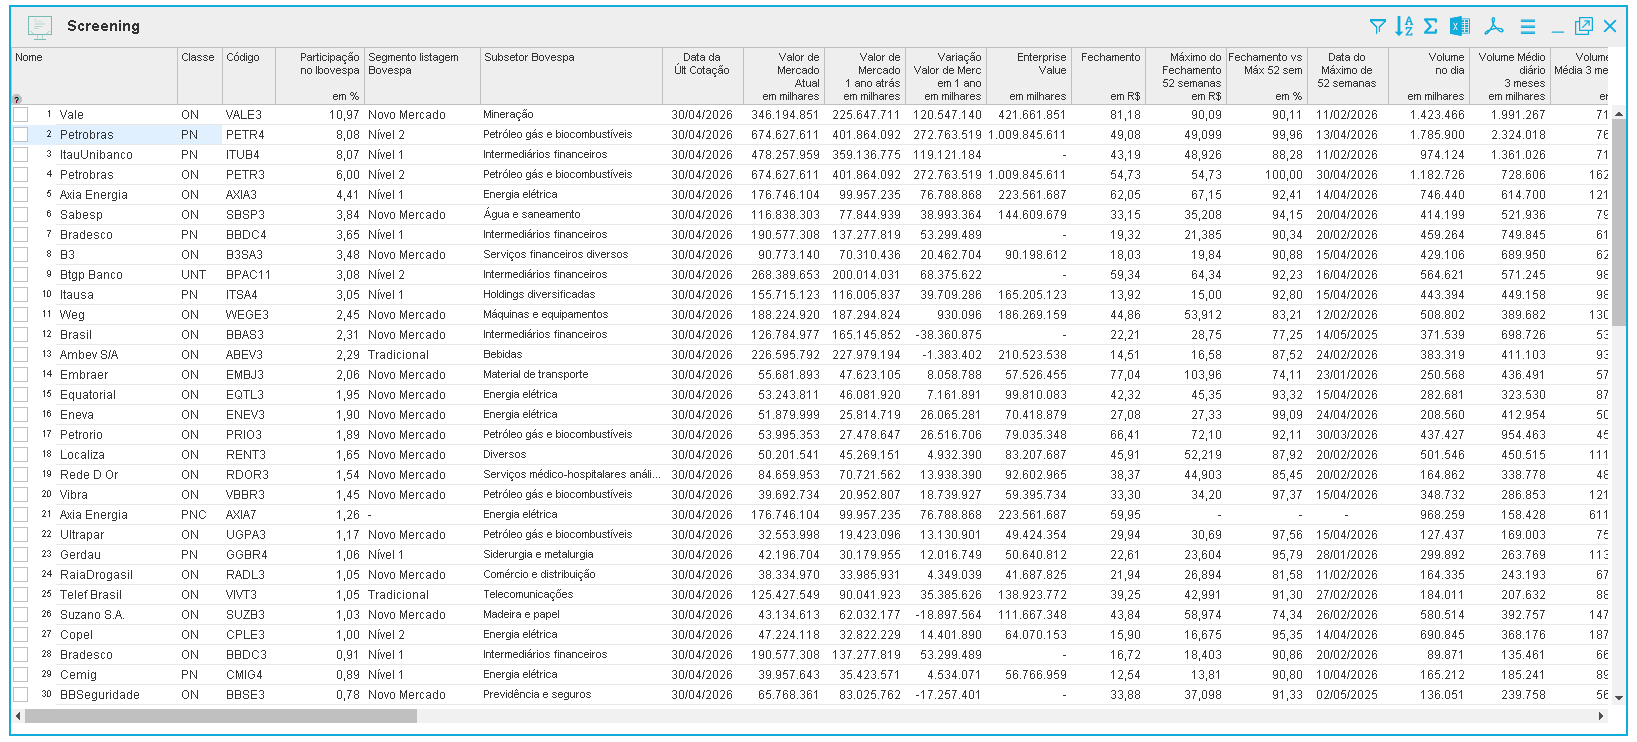
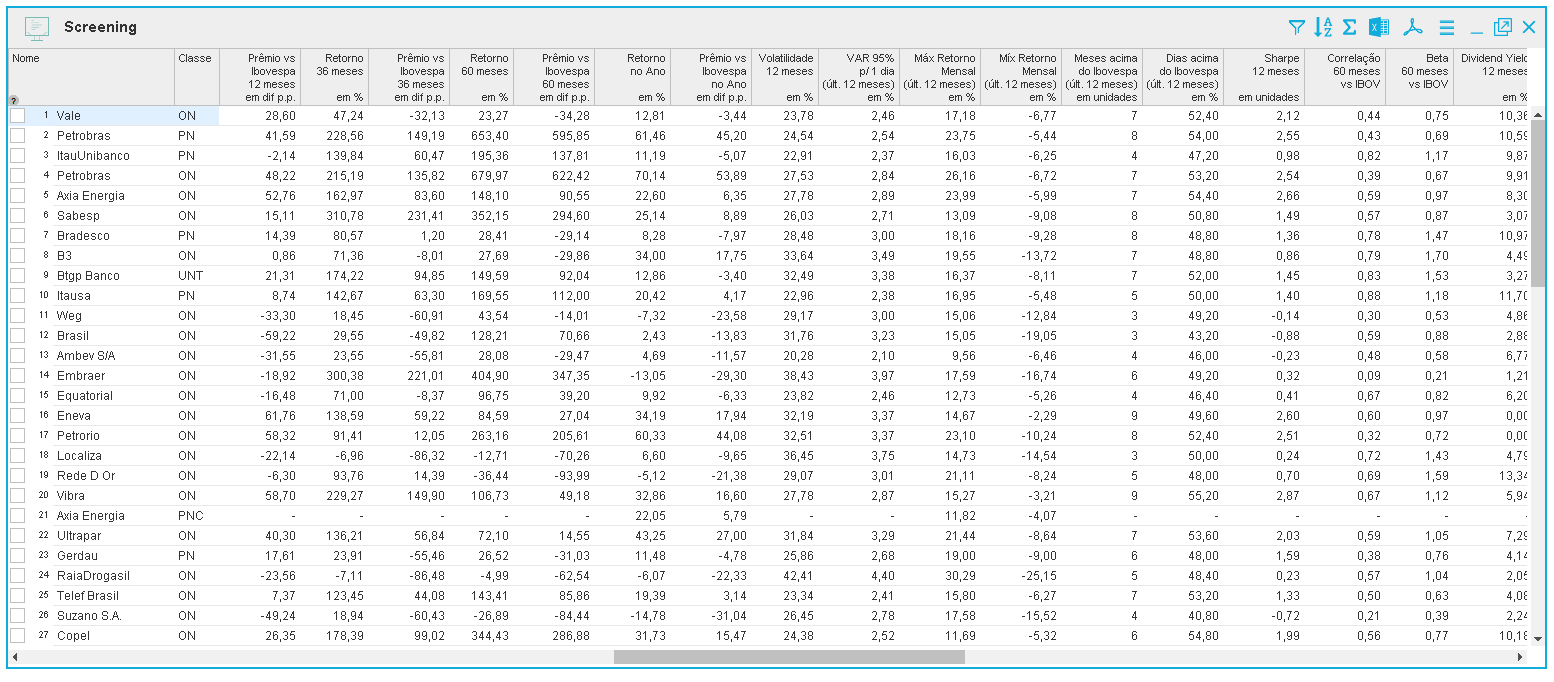
Screening
Asset sweep with combinable filters by fundamental, technical, and market indicators. Find assets matching specific criteria in a short time.
Combined filtersSaved templatesExport ExcelMulti-database
The layer where 40 years of proprietary data turn into a usable experience: market data, indicators, analytical tools, and reports in an interface designed for analyst productivity.
The Economatica Platform is the company's central financial analysis environment. It translates a broad and reliable historical base into a practical, deep, decision-oriented experience, combining proprietary data, analytical tools, and export in a single workflow for analysts, portfolio managers, research, and financial operations.
From quick screening to the full DCF model, the Platform features cover the entire asset investigation cycle. Select one below to see description, specs, and visual.
Asset sweep with combinable filters by fundamental, technical, and market indicators. Find assets matching specific criteria in a short time.
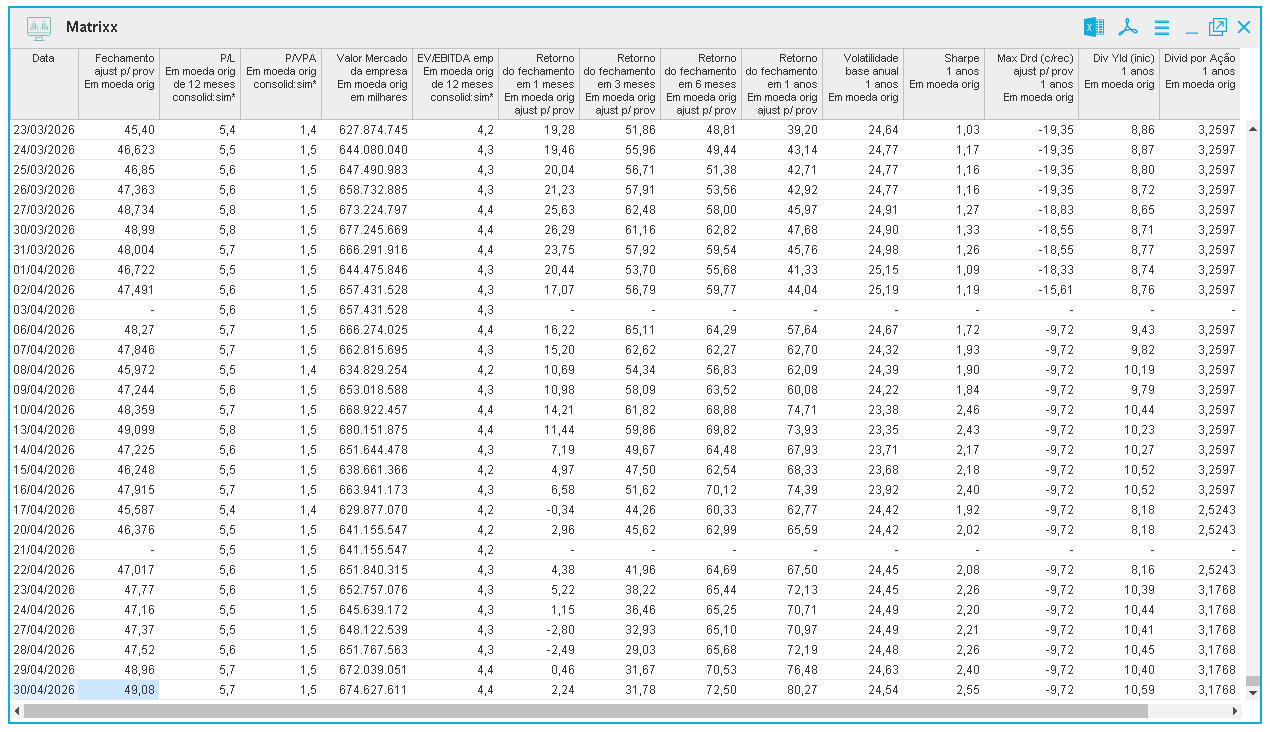
Comparative asset matrix with selected indicators from the Economatica base. Compare companies, funds, or portfolios side by side with aligned historical series and automatic descriptive statistics.
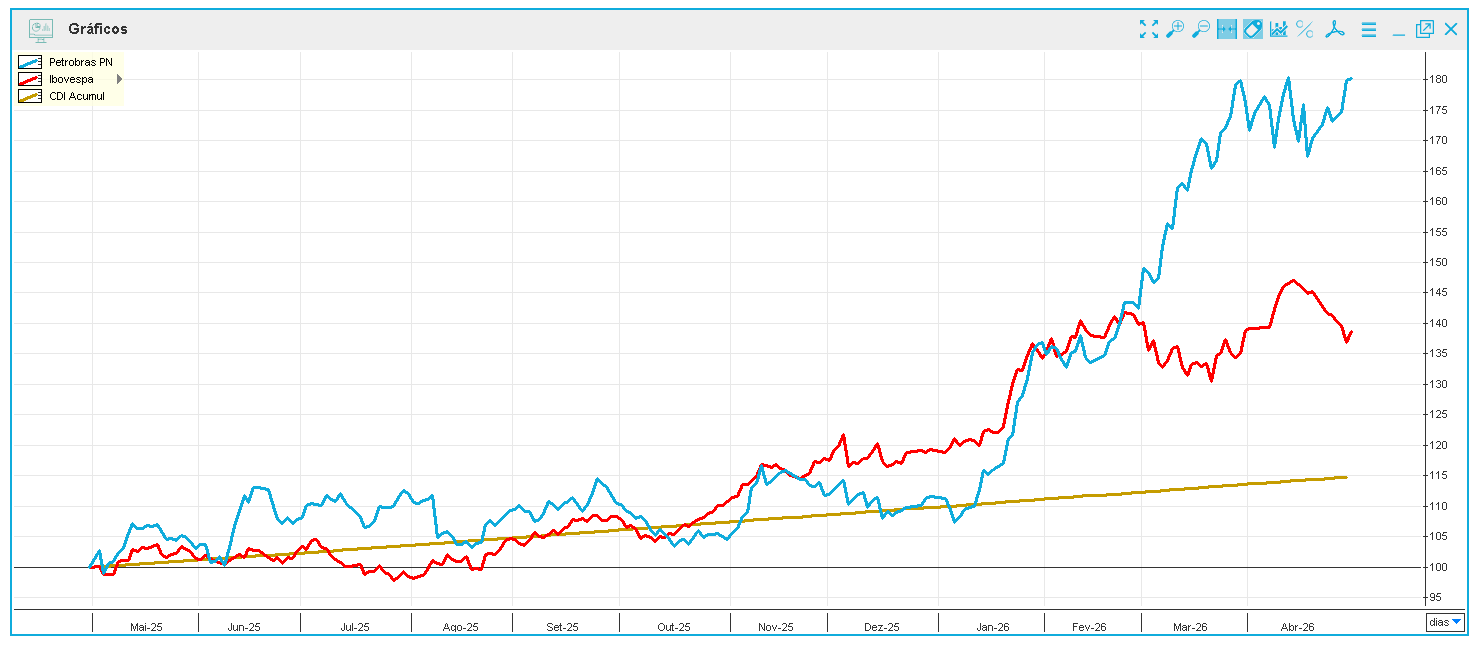
Analytical charts with technical indicators, drawings, multiple timeframes, and series overlay. Integrates fundamental and technical analysis in the same workflow.
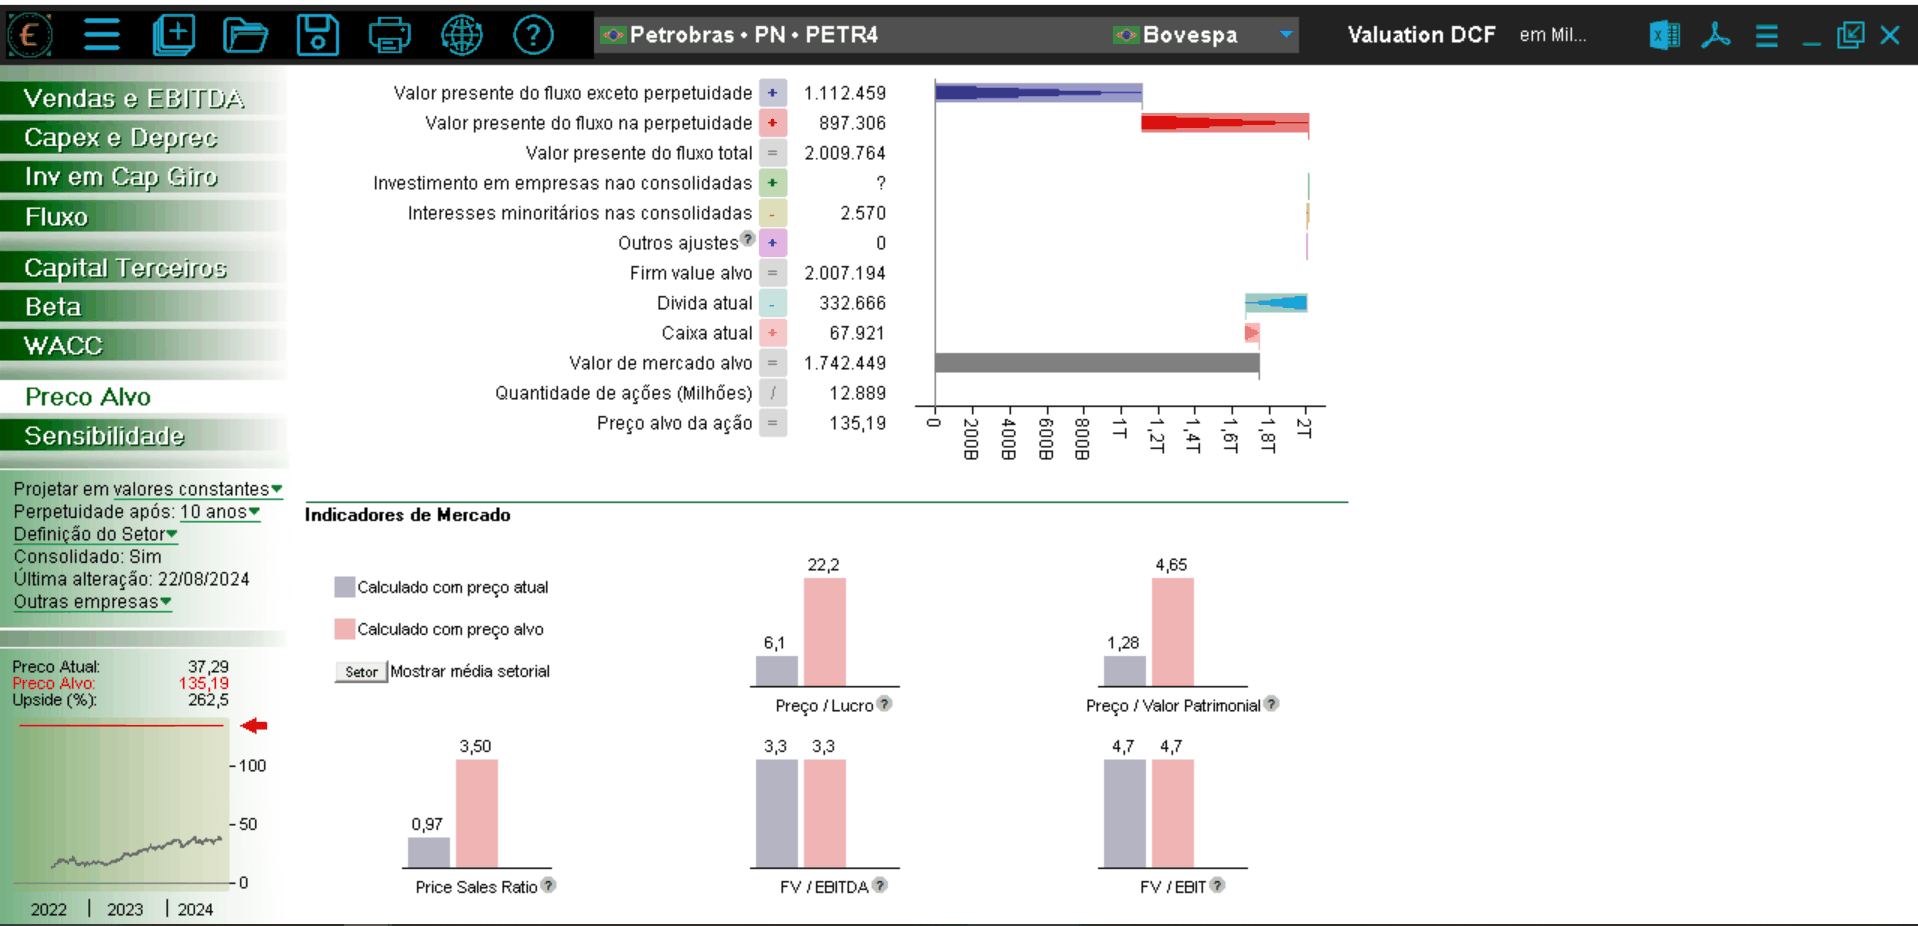
Discounted Cash Flow model preconfigured with Economatica data. Project revenue, EBITDA, WACC, and target price with automatic sensitivity and scenarios.
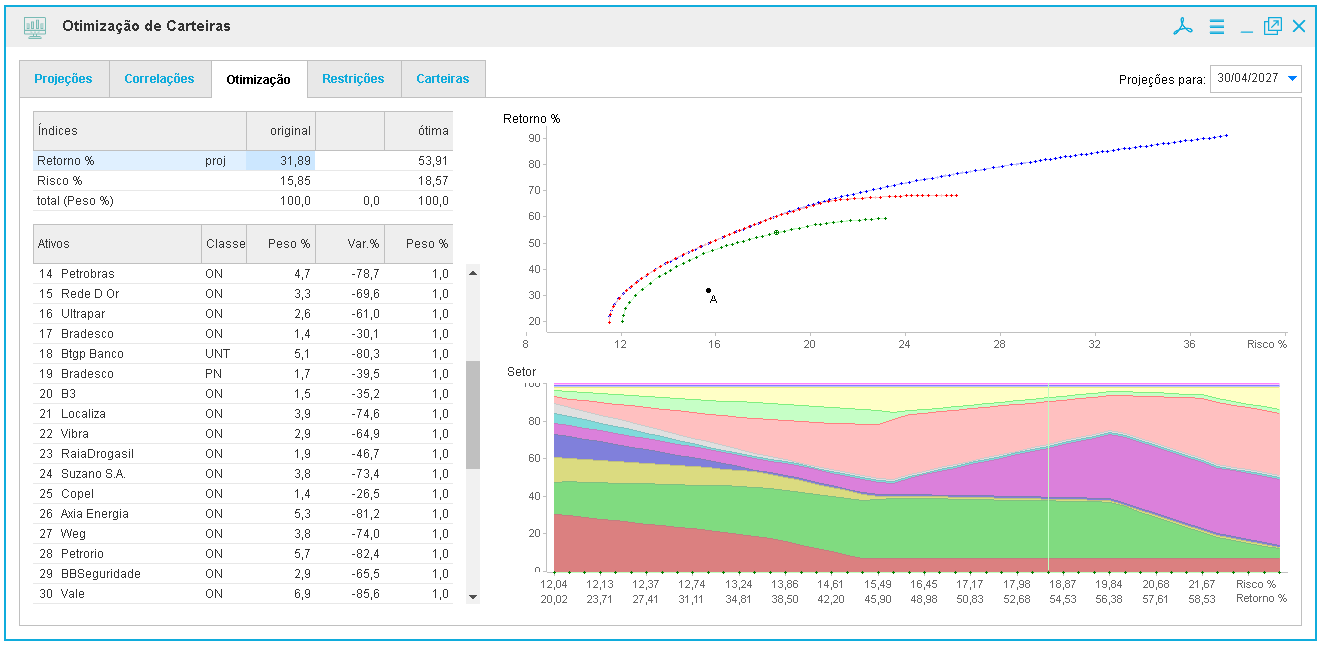
Portfolio optimization tool based on Markowitz, with efficient frontier, optimal risk-return allocation, customizable constraints, and simulated rebalancing over 40 years of history.
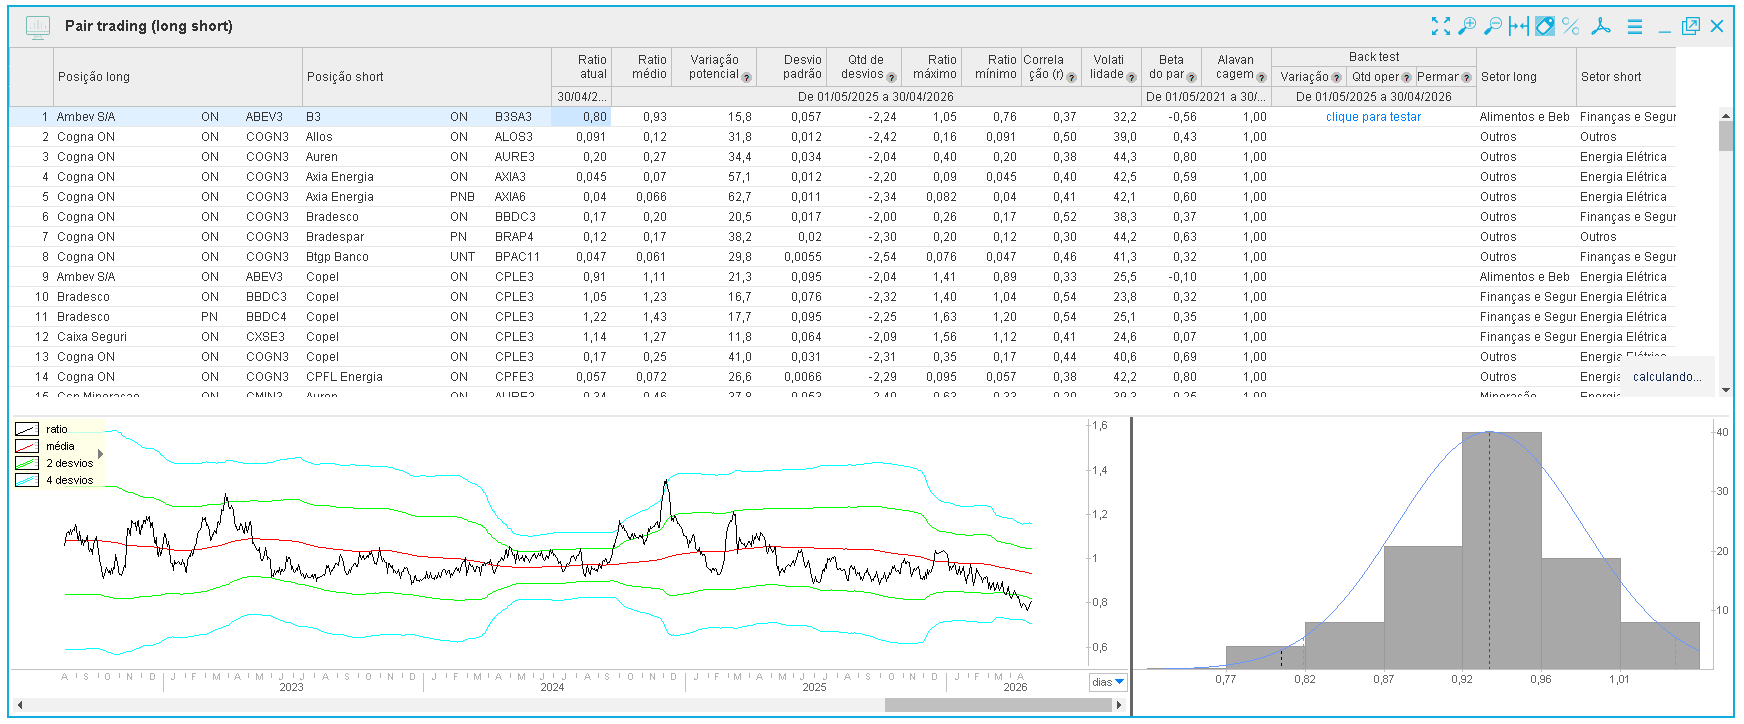
Pair analysis, cointegration, and normalized spread for investigating relationships between correlated assets.
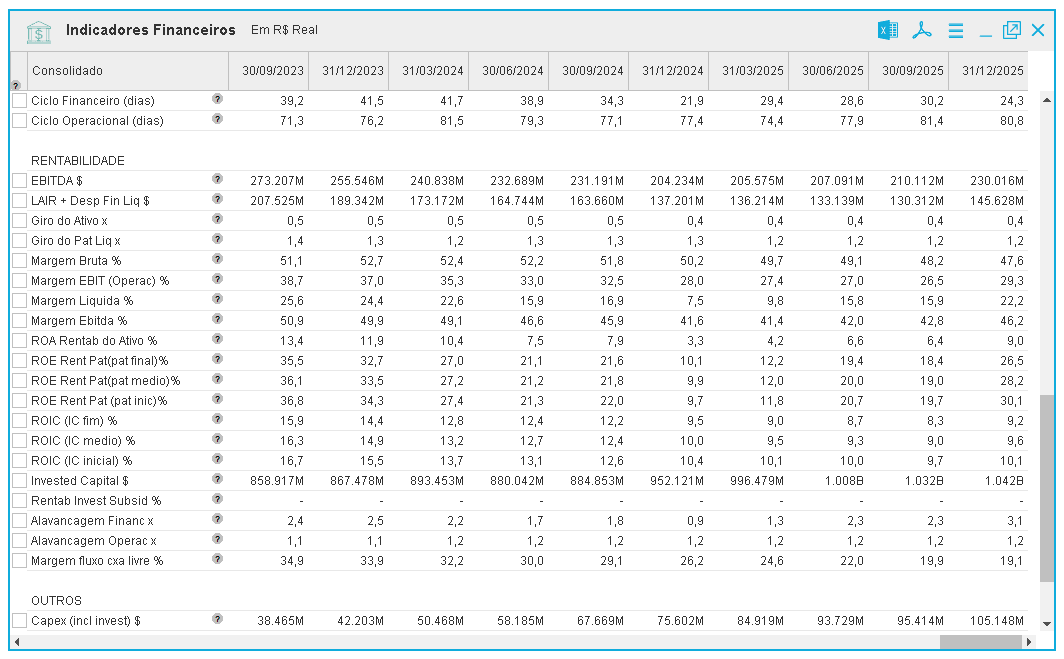
A wide range of financial indicators calculated on the Economatica base: multiples, liquidity, leverage, profitability, growth, quality, valuation, in consistent historical series.
A range of technical indicators applicable to assets in the base, with configurable parameters and periods, subject to availability.
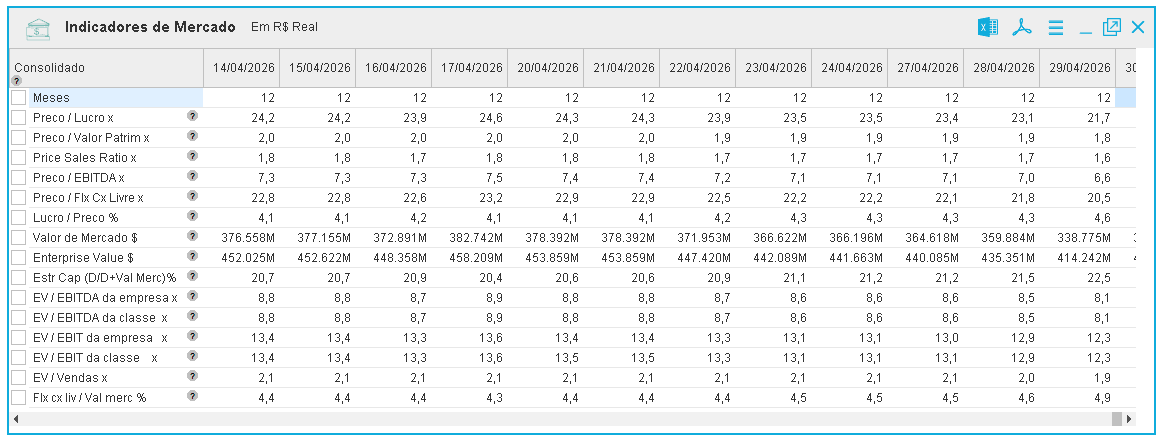
P/L, P/VPA, EV/EBITDA, Market Value, Enterprise Value and other market indicators calculated over the Economatica historical base.
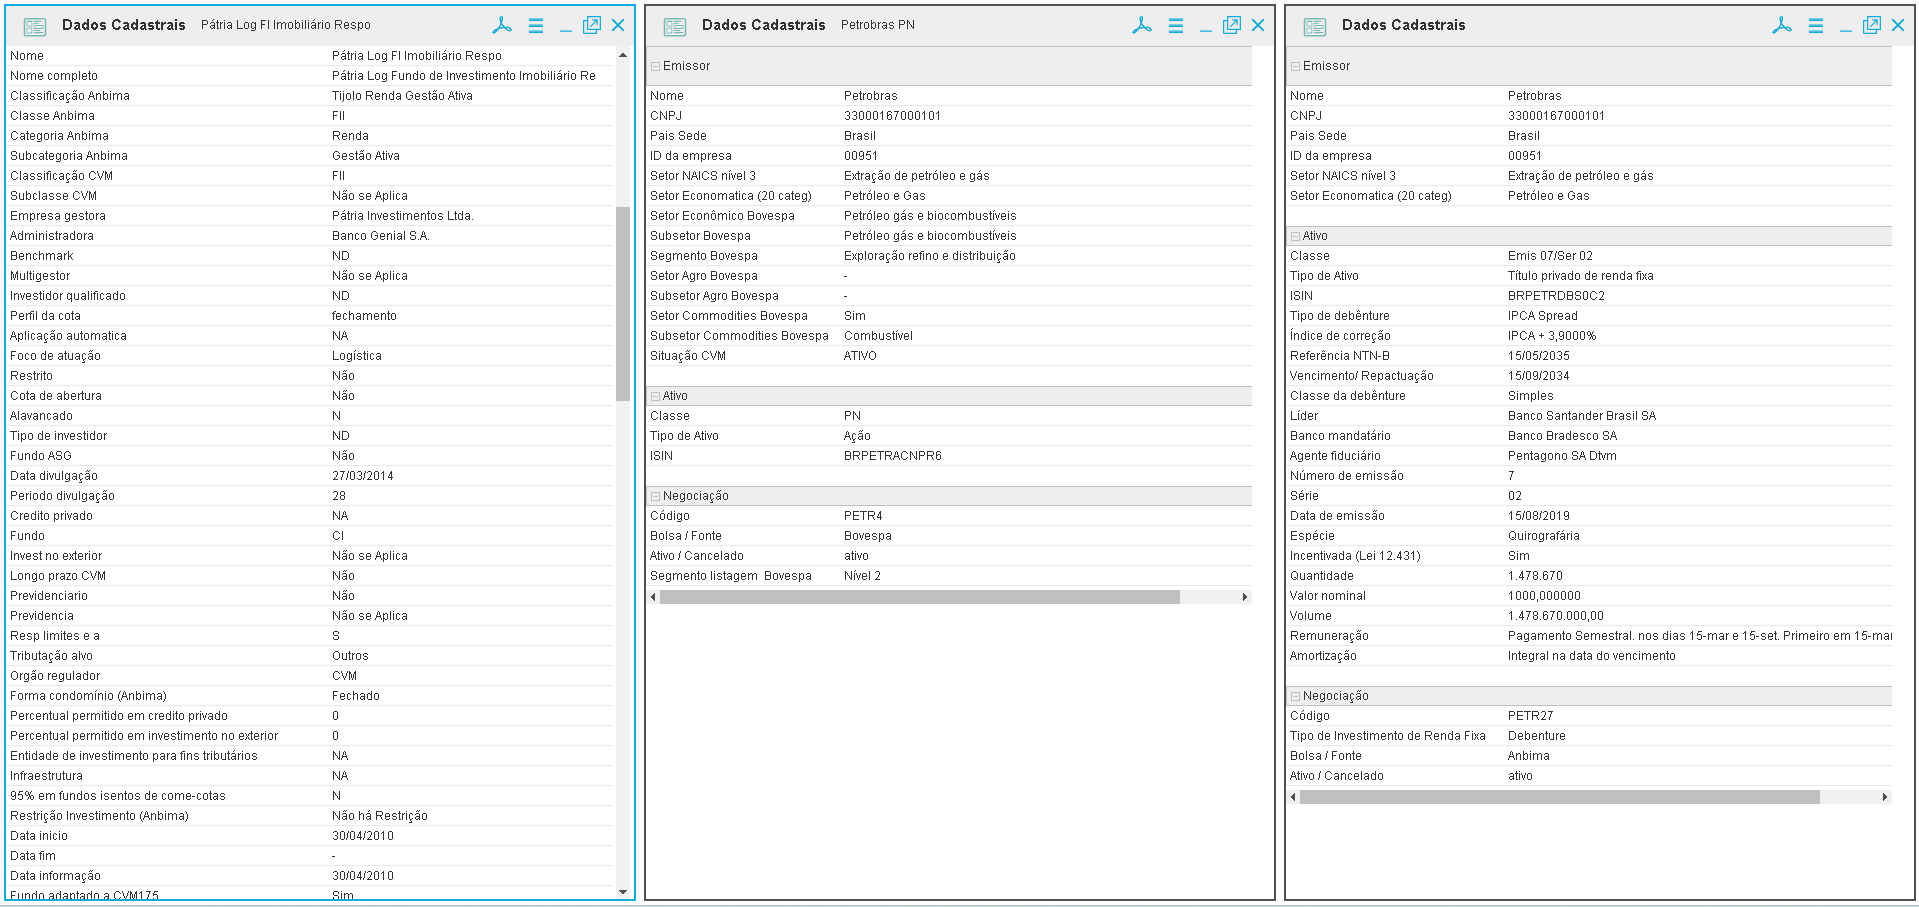
Issuer profile with identifiers, classifications, and characteristics available in the base.
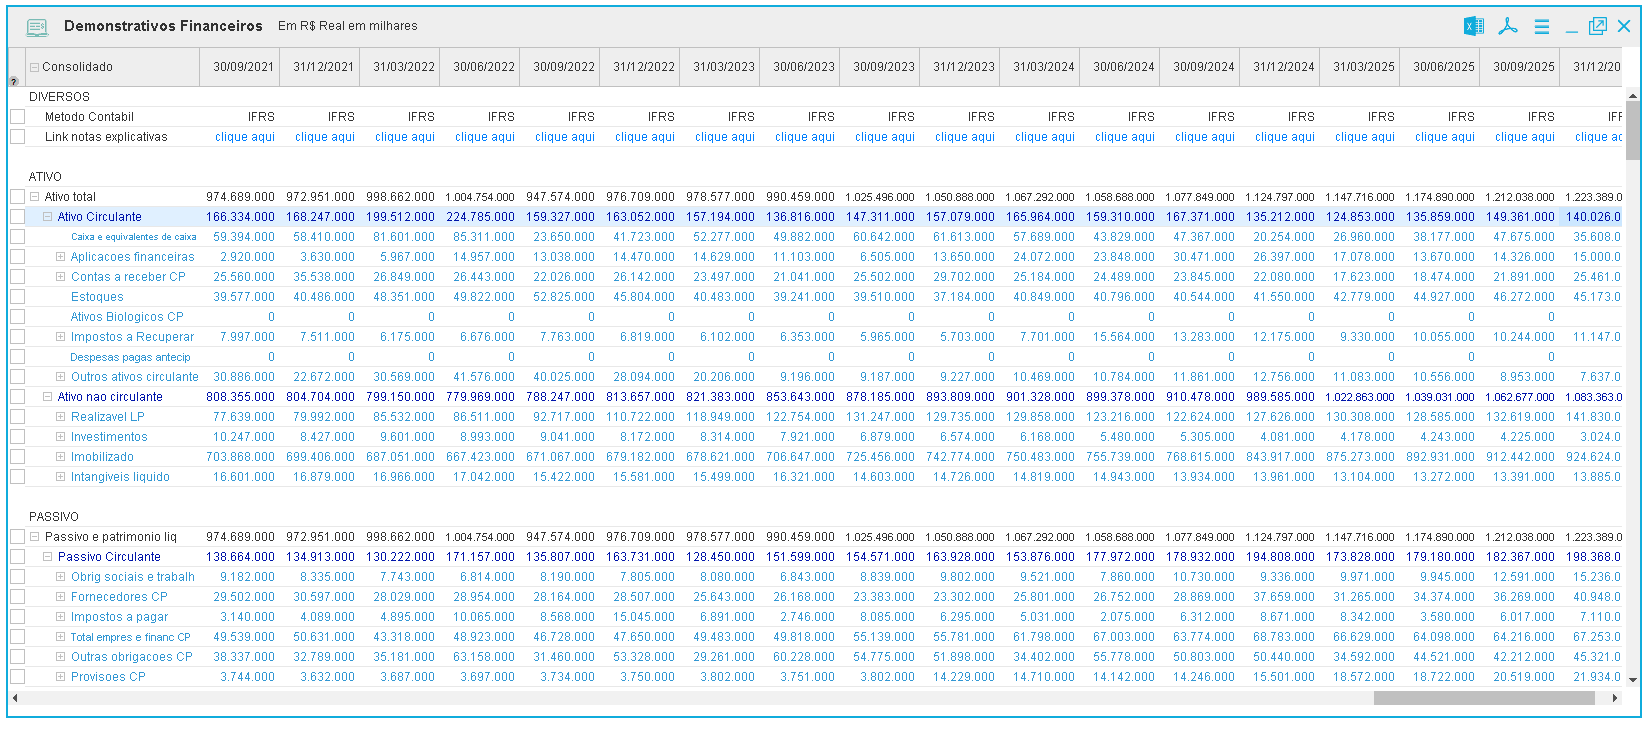
Balance sheets, income statements, cash flow statements, and other financial statements in IFRS and other formats, with comparable historical series and consolidation adjustments since 1986.
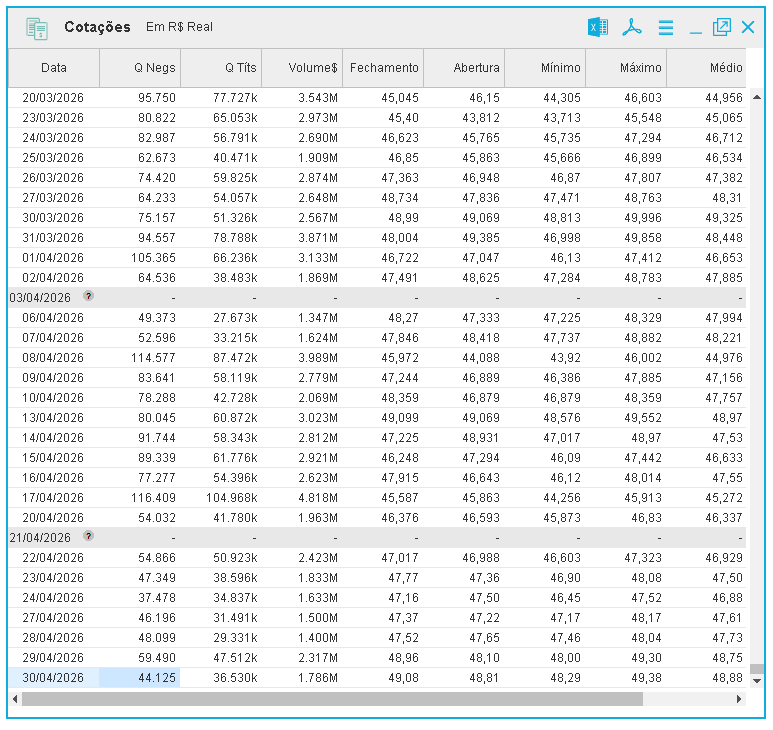
Historical quotes with adjustments for dividends, splits, and bonuses; international coverage of stocks, funds, indices, currencies, and fixed income.
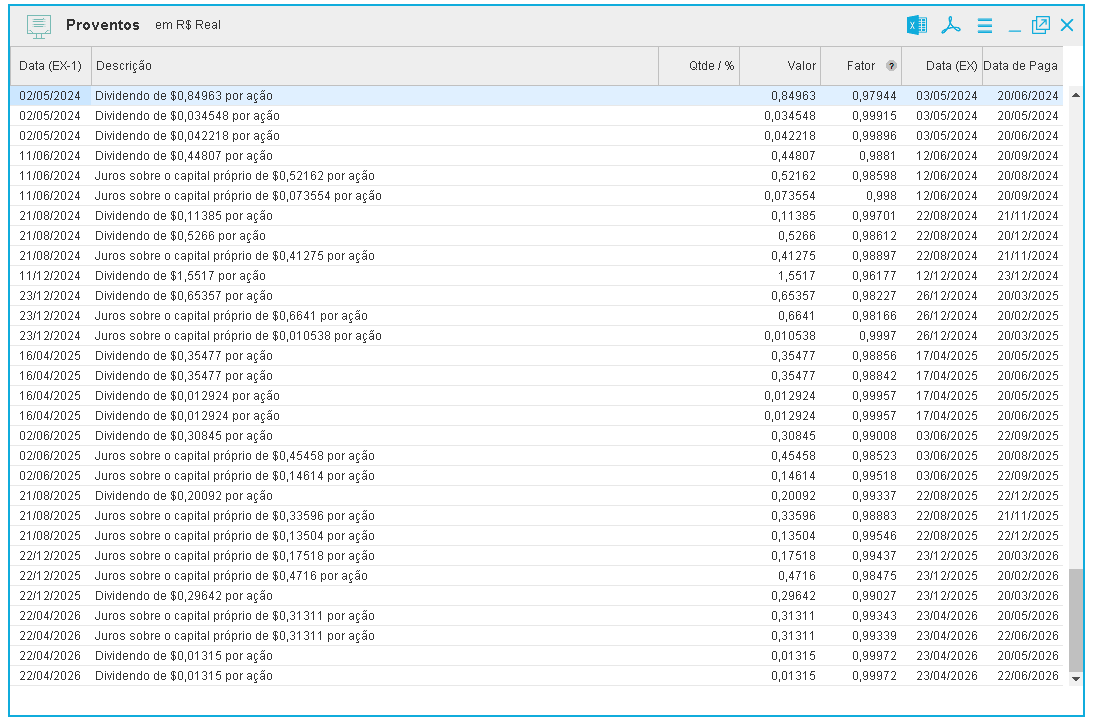
Dividends, JCP (interest on equity), bonuses, and splits with ex-date, payment date, and approved amount. Cash distribution and corporate event data used in the price adjustment methodology.
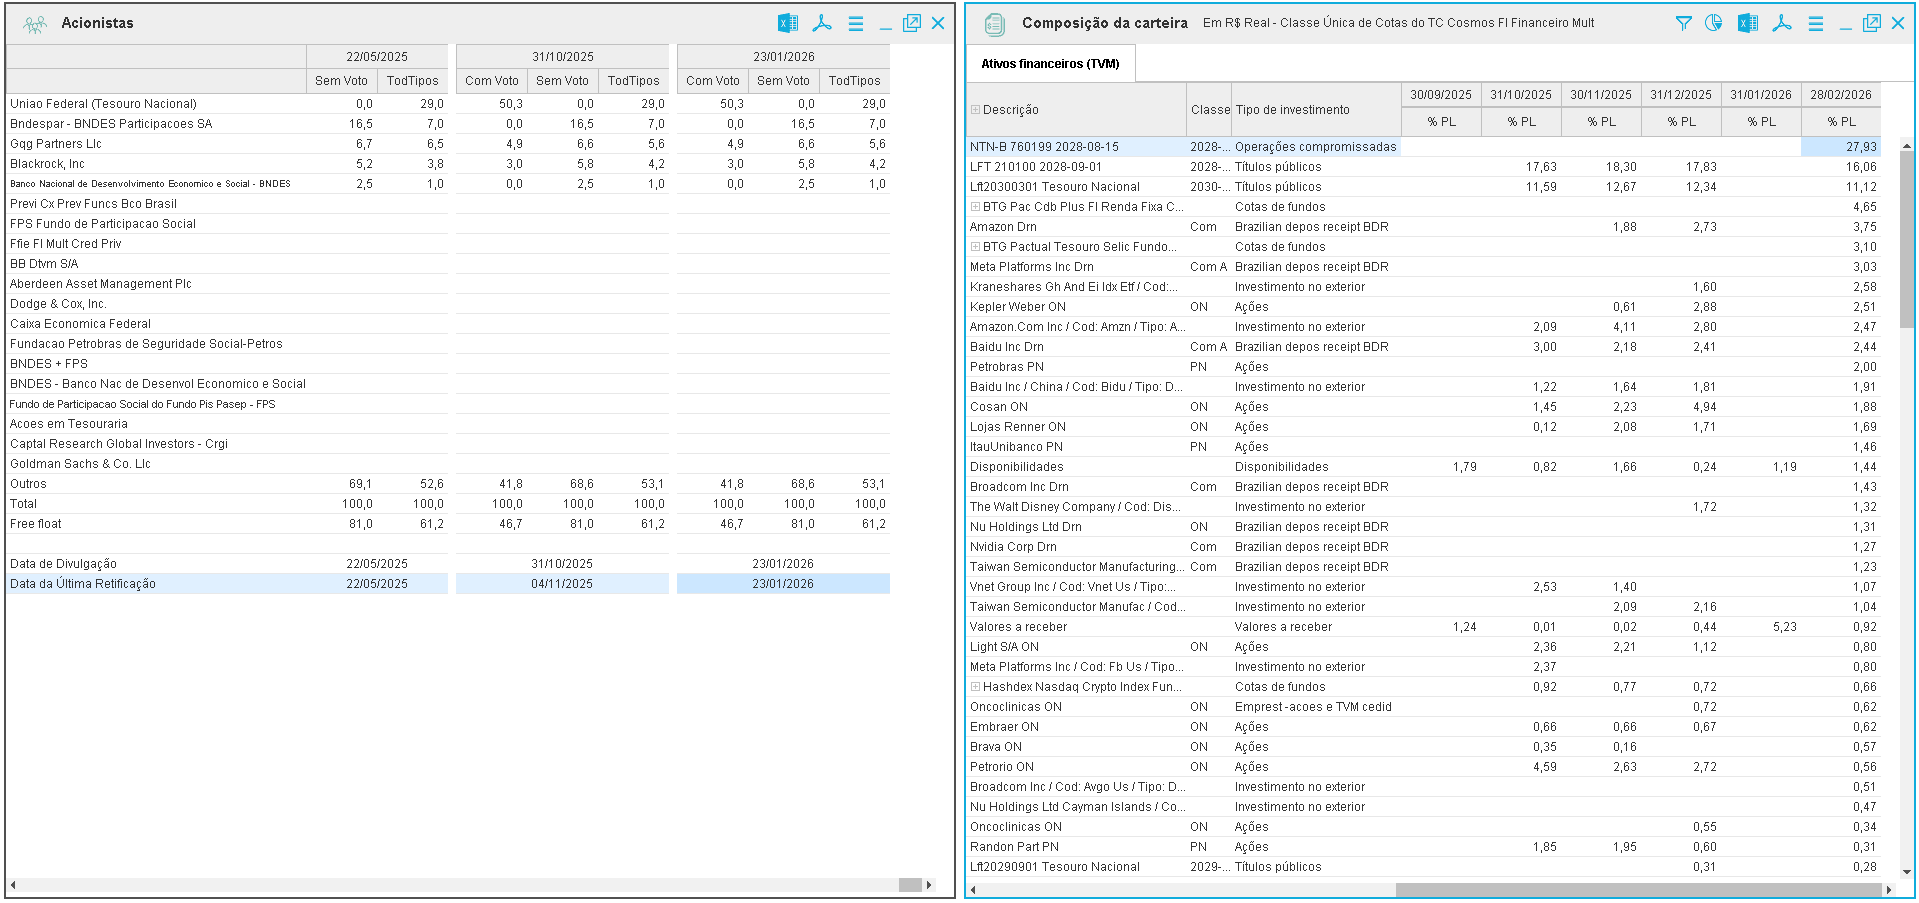
Shareholder structure, control, free float, declared positions, and composition of main portfolios and indices, with updates as sources and disclosures become available.
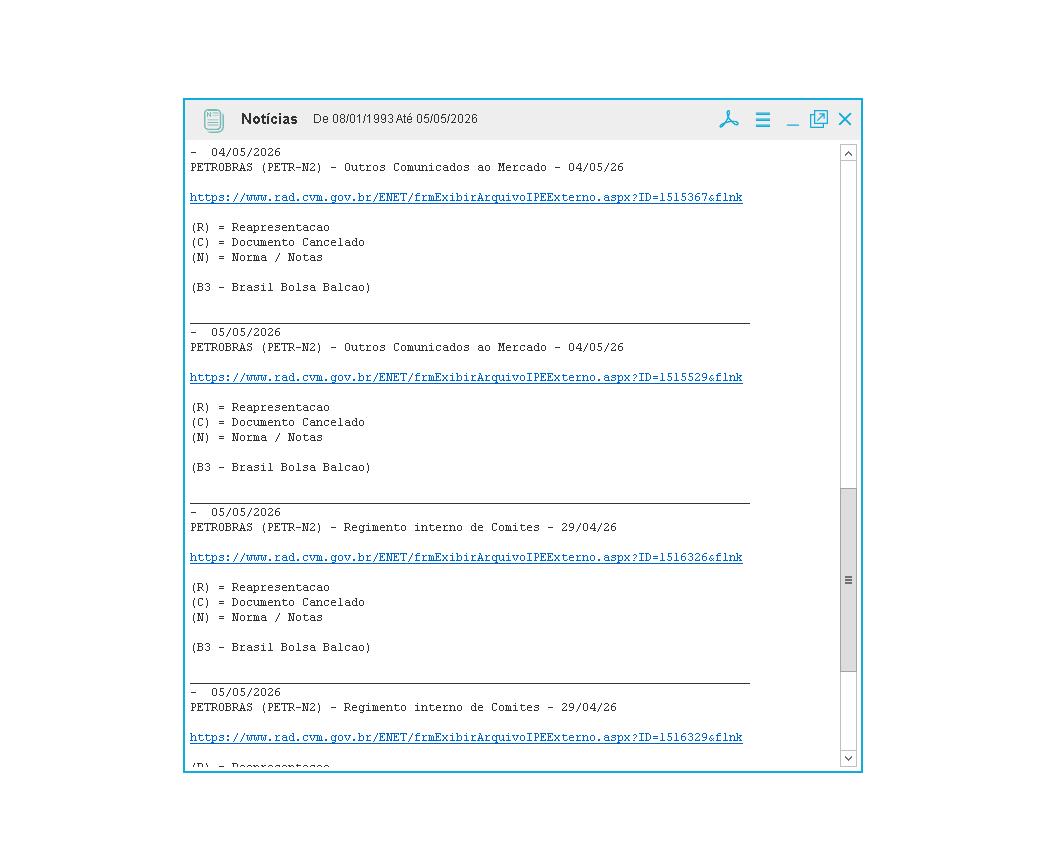
Official company facts and disclosures updated hourly.
Explore even more features. The Platform offers additional customizable resources for each type of analysis.
The Platform combines proprietary data, analytical tools, and export capability in a single environment. Faster to find data, compare assets, simulate scenarios, and produce analysis with the depth the market expects.
The Platform is the operational core of analysis in the routine of multiple profiles.
Schedule a demo and see the Economatica Platform connected to your analysis team.
Choose where to log in