AI agent New
Kento Workspace
Your access to the AI agent and all Economatica services, on any device.
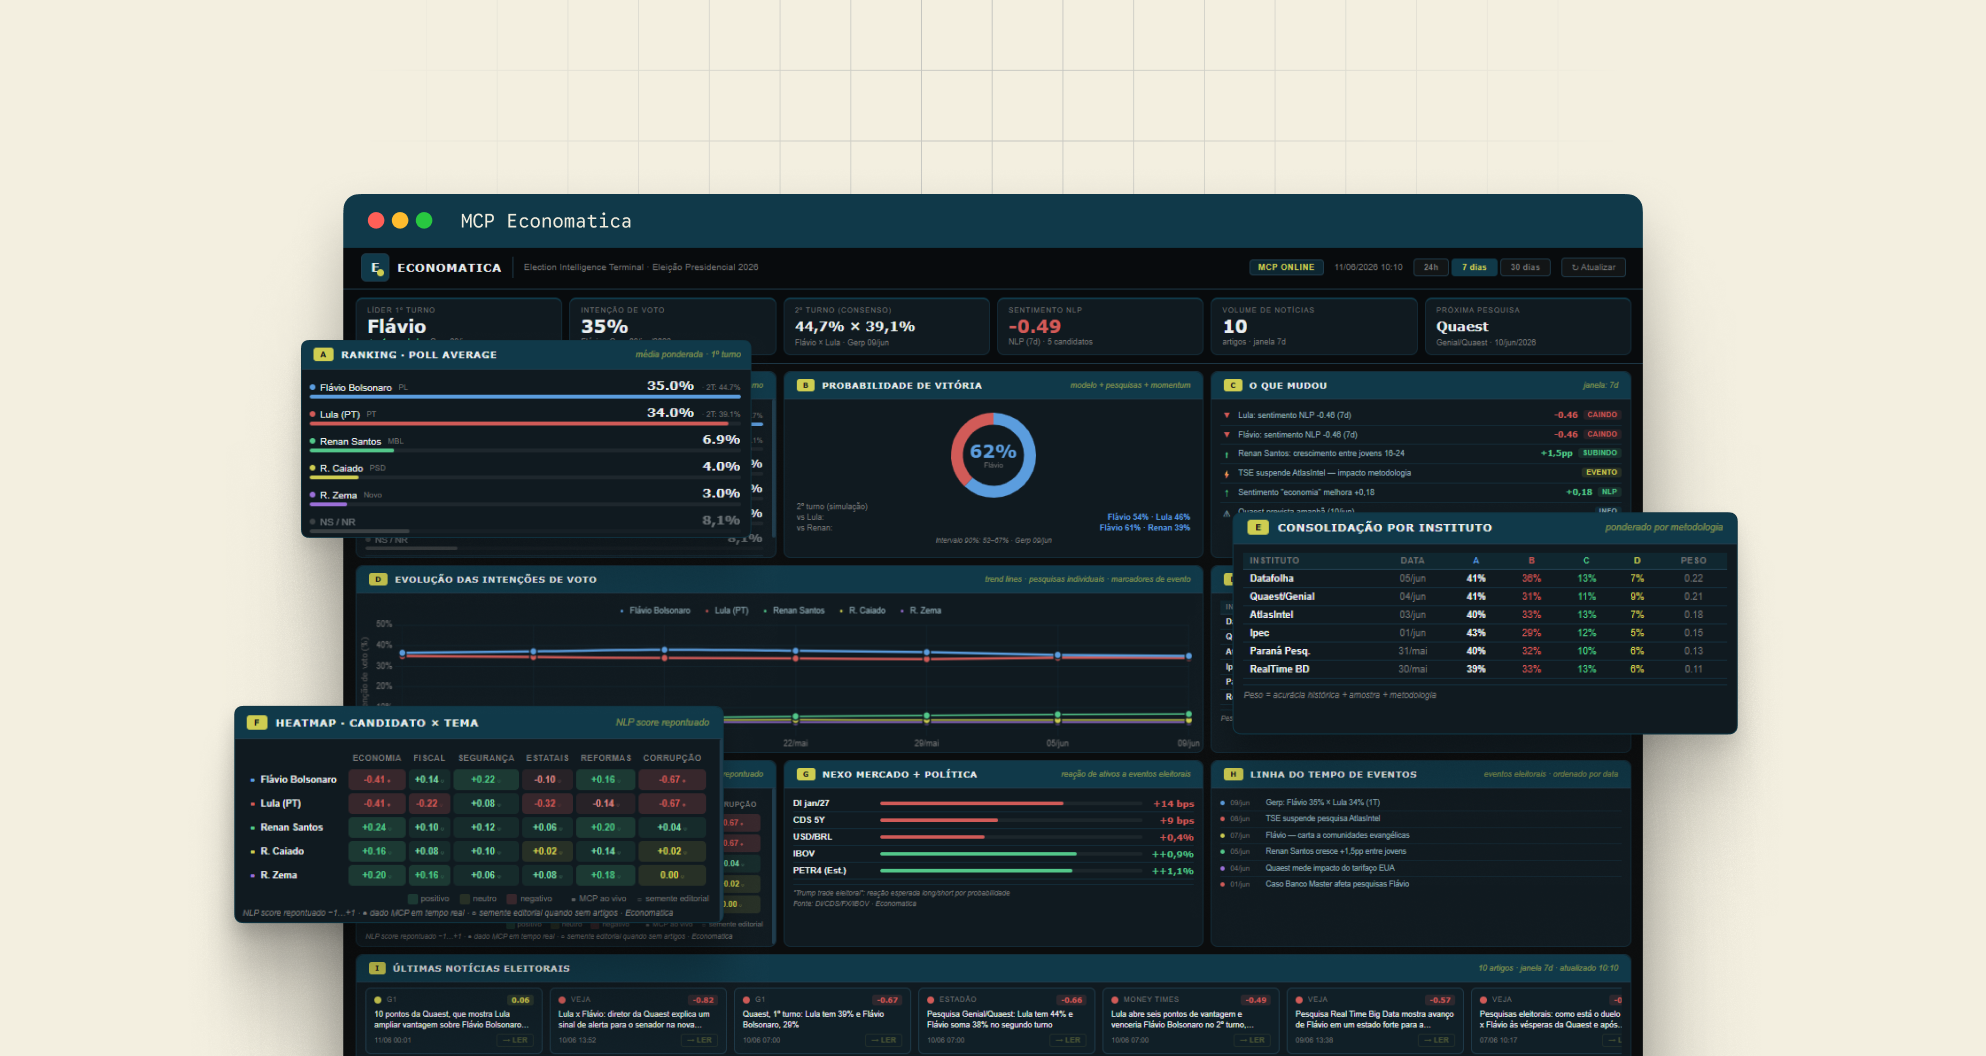
Brazil's 2026 presidential election is expected to be an important source of market volatility. For asset managers, analysts and research teams, the challenge is to turn a growing flow of polls, news and political events into usable intelligence.
Economatica MCP in Claude brings polling information, news sentiment and market data into one interface. Users can create election dashboards as Claude artifacts by describing in natural language what they want to follow. The dashboard in this demonstration was built that way to track changes in the electoral landscape and their potential market effects.
Economatica's Model Context Protocol (MCP) connects AI tools to data and functions from the Economatica platform. Three tools are especially relevant to this demonstration:
Together, these tools connect information that would otherwise require several separate systems.
The demonstration groups its information into panels fed by Economatica MCP.
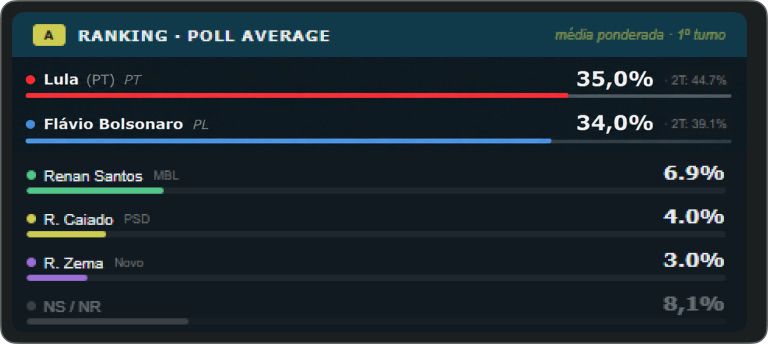
Panel A: polling ranking. It presents candidate vote intention using a weighted average of recent polls. The method considers each pollster's methodology, sample size and historical accuracy.
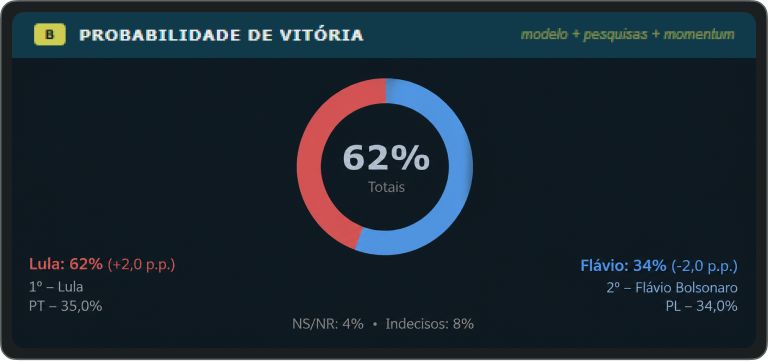
Panel B: probability of victory. It models second-round scenarios from current polling data and updates when a new poll is indexed.
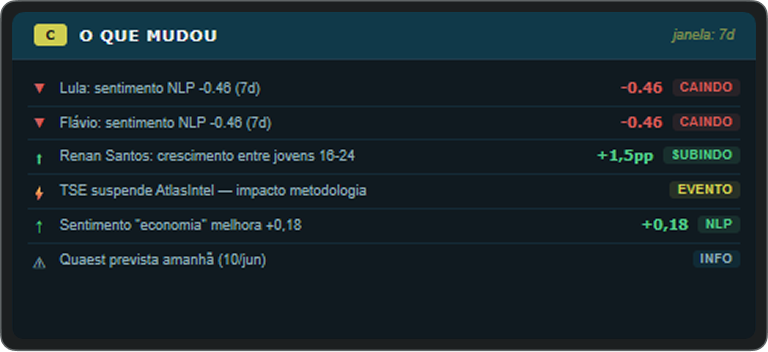
Panel C: what changed. It highlights significant moves over a chosen window of 24 hours, seven days or 30 days, including sharp changes and critical events.
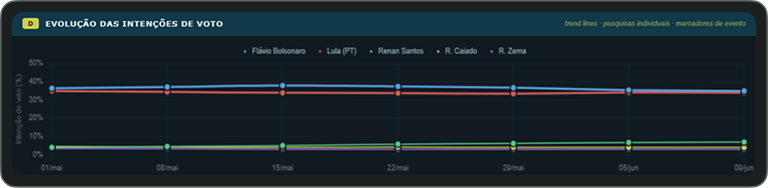
Panel D: trends over time. A line chart follows each candidate and marks major political events.
Panel E: pollster comparison. A table shows each polling organization's figures and its weighting in the aggregator.
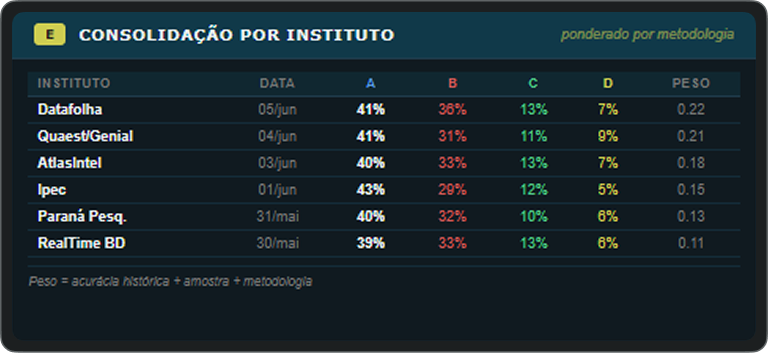
The result is an updated view of information that would otherwise take an analyst considerable time to assemble manually.
Sentiment analysis goes beyond counting positive and negative mentions. Economatica's model assigns a continuous score to each indexed article, which can then be aggregated by candidate and topic.
Panel F: sentiment heatmap. The demonstration compares five candidates across six market-relevant themes: economy, fiscal policy, security, state-owned companies, reforms and corruption. Each cell shows the average sentiment of articles that mention both the candidate and the theme.
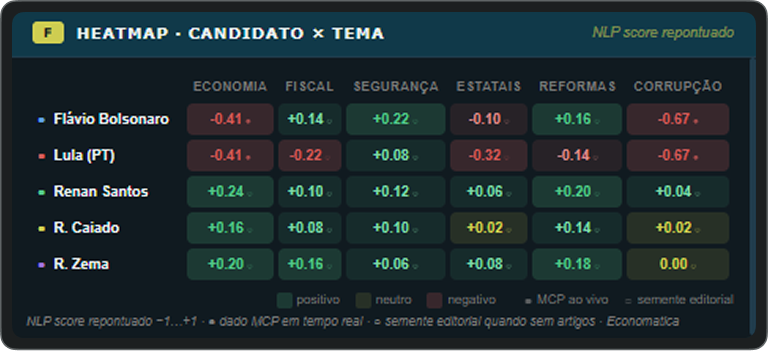
A candidate may have neutral coverage overall but negative coverage related to state-owned companies. Another may receive positive economic coverage. These are signals for analysts to investigate, rather than investment conclusions.
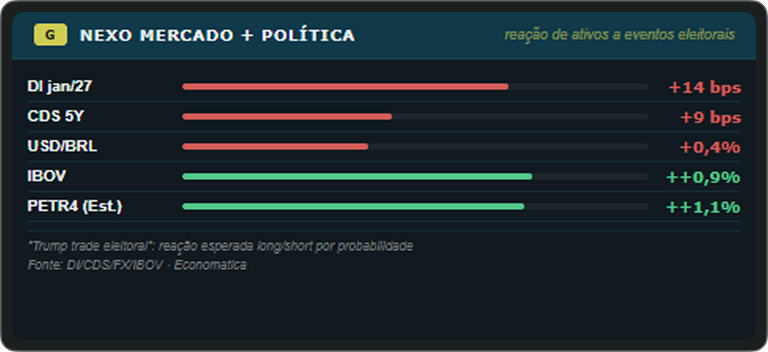
Panel G: markets and politics. The dashboard also places key assets and indicators, including Brazilian interest-rate futures, five-year CDS, USD/BRL, Ibovespa and PETR4, alongside recent election events.
Following polls and trends is useful, but analysts also need to see what is being published now. The news panel displays recently indexed election articles with a sentiment score and a direct link to the full story.

Each card includes a color and numerical sentiment indicator from −1 to +1, the source and headline, publication time and a link to read the original article. The feed can show up to 24 items for a selected 24-hour, seven-day or 30-day window.
Combining speed with a traceable signal helps a research team identify which narratives are dominating coverage and then apply its own judgment to the data.
An integrated view of polls, sentiment and market data reduces the time spent collecting and formatting information. It does not replace the analyst's interpretation. Economatica makes this infrastructure available through MCP in supported AI environments; the election dashboard is one example of its use.
Teams working in equity research, asset management or political-risk analysis can use Economatica MCP to connect news, sentiment, quotes, company fundamentals and event calendars. Explore Economatica MCP or contact the team.
This article demonstrates an application of Economatica MCP. The cited election-poll data is public-domain information processed for demonstration purposes. It is not investment advice.


Economatica's official Perplexity connector brings financial data and Kento tools into the research workflow professionals already use.
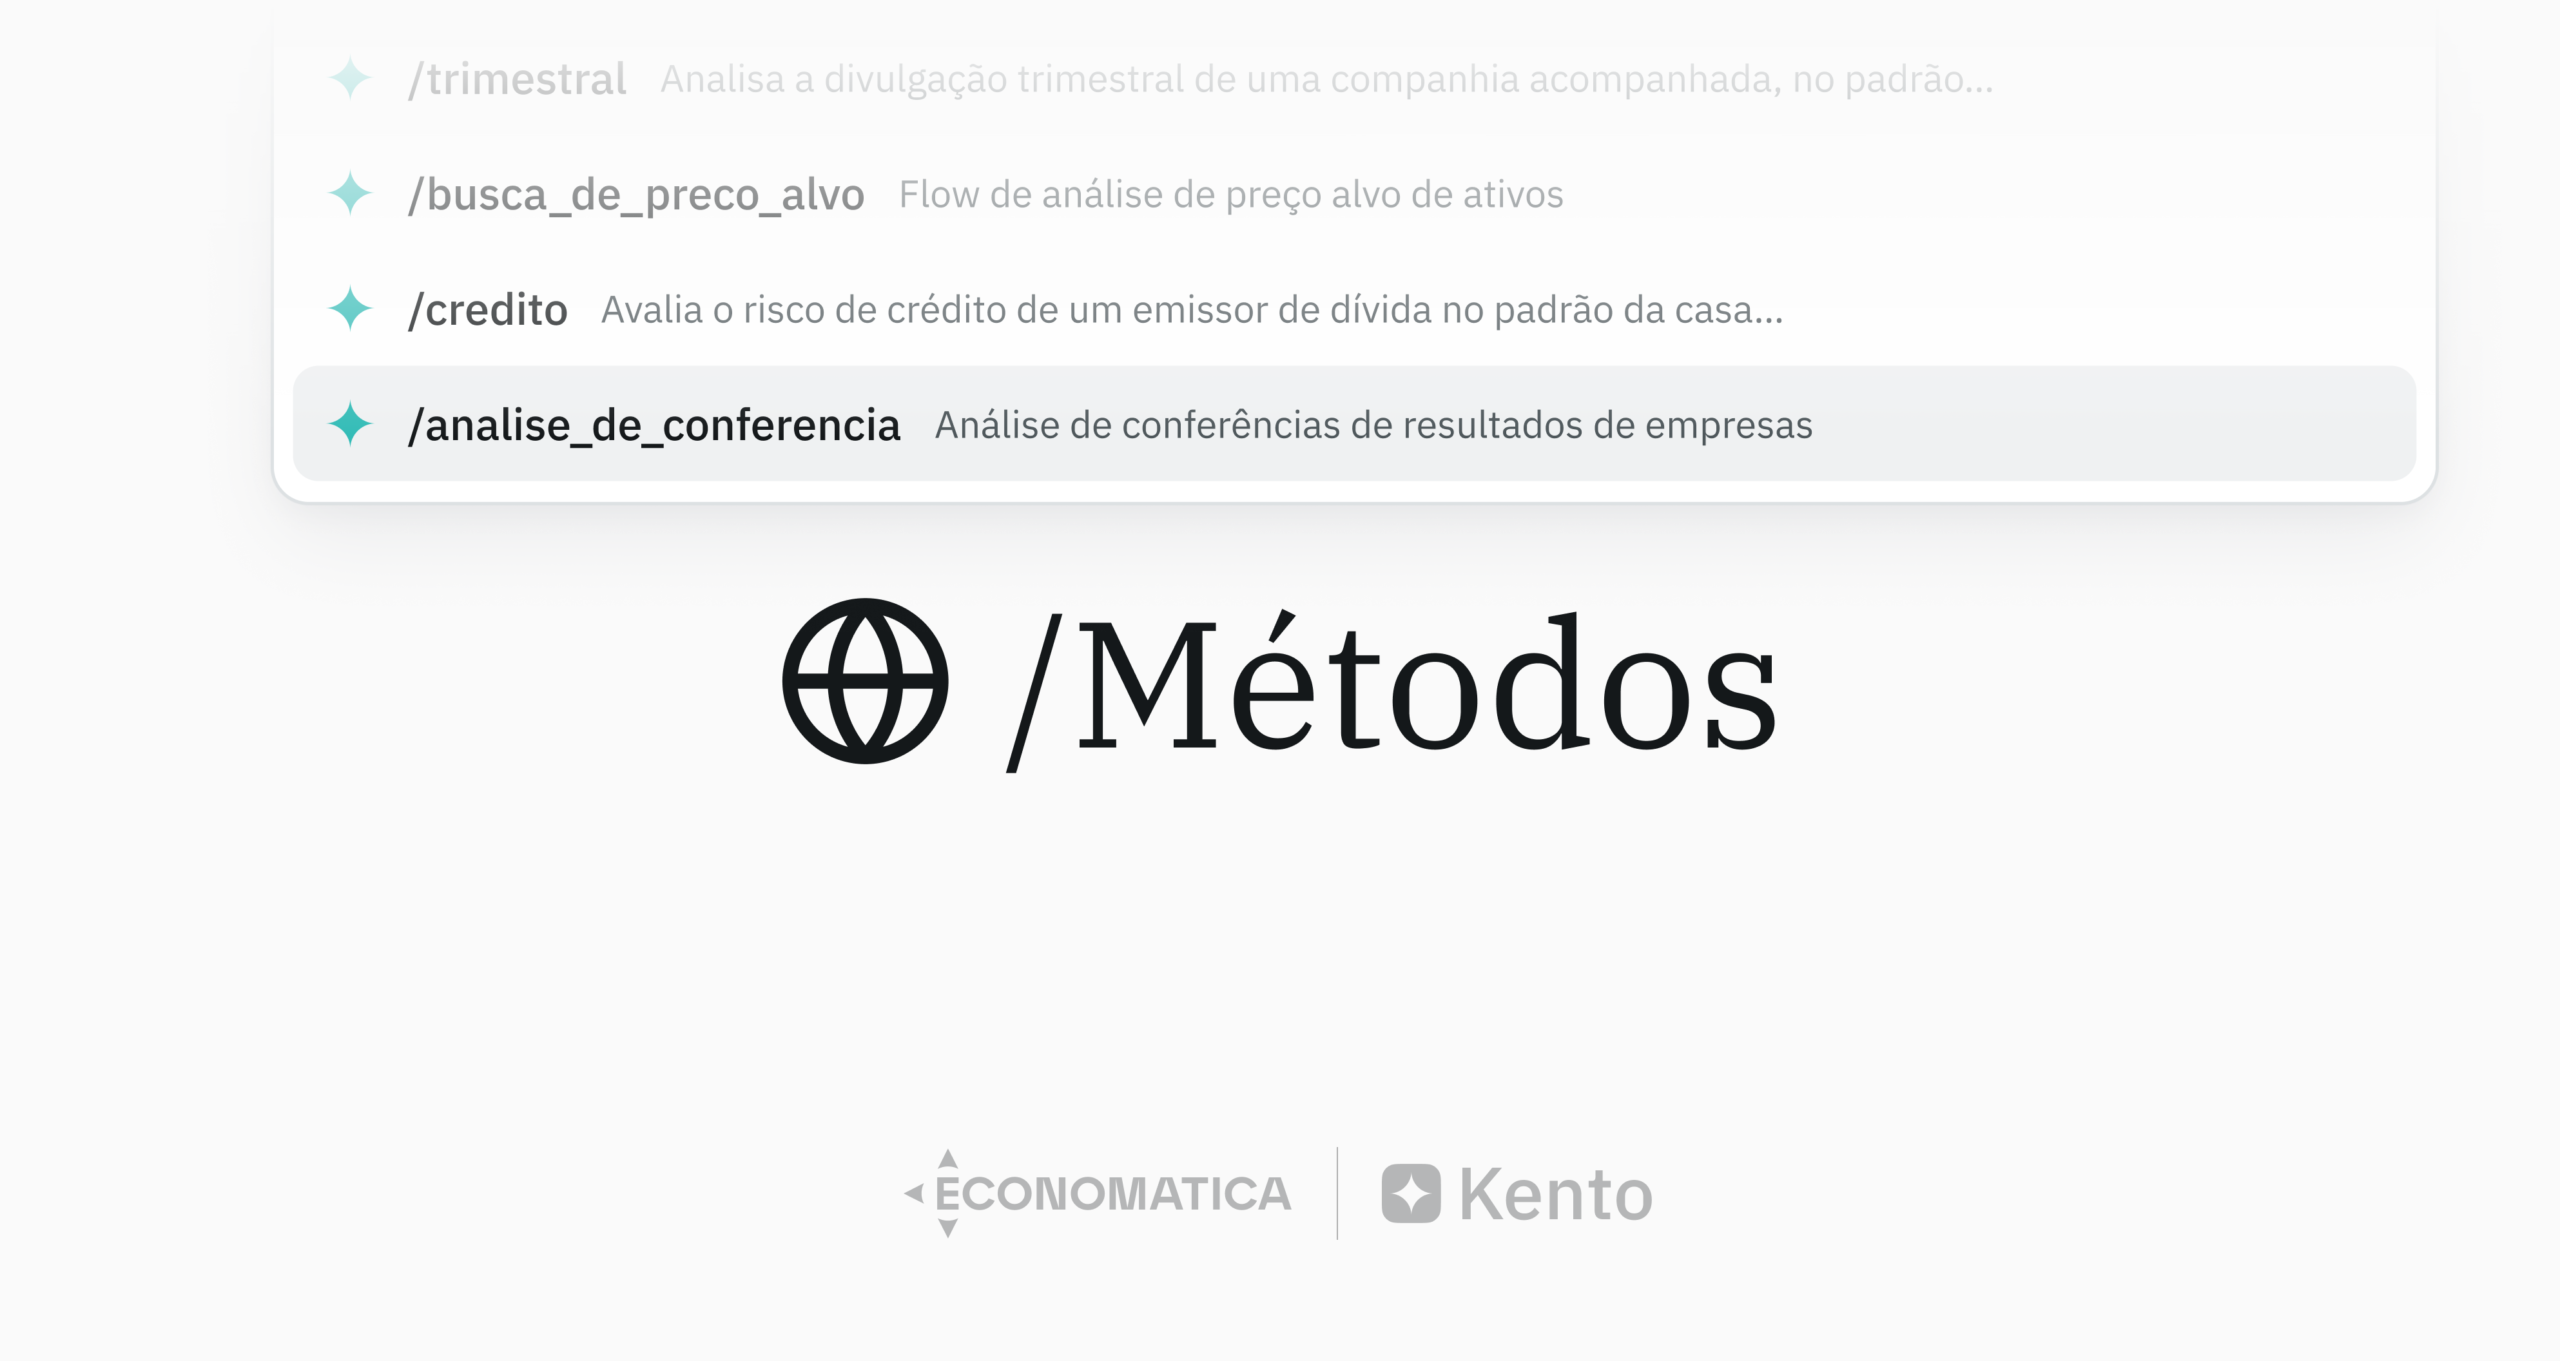
Kento Methods make a firm's own analysis standards available to every authorized team member, with versioning and checks before delivery.
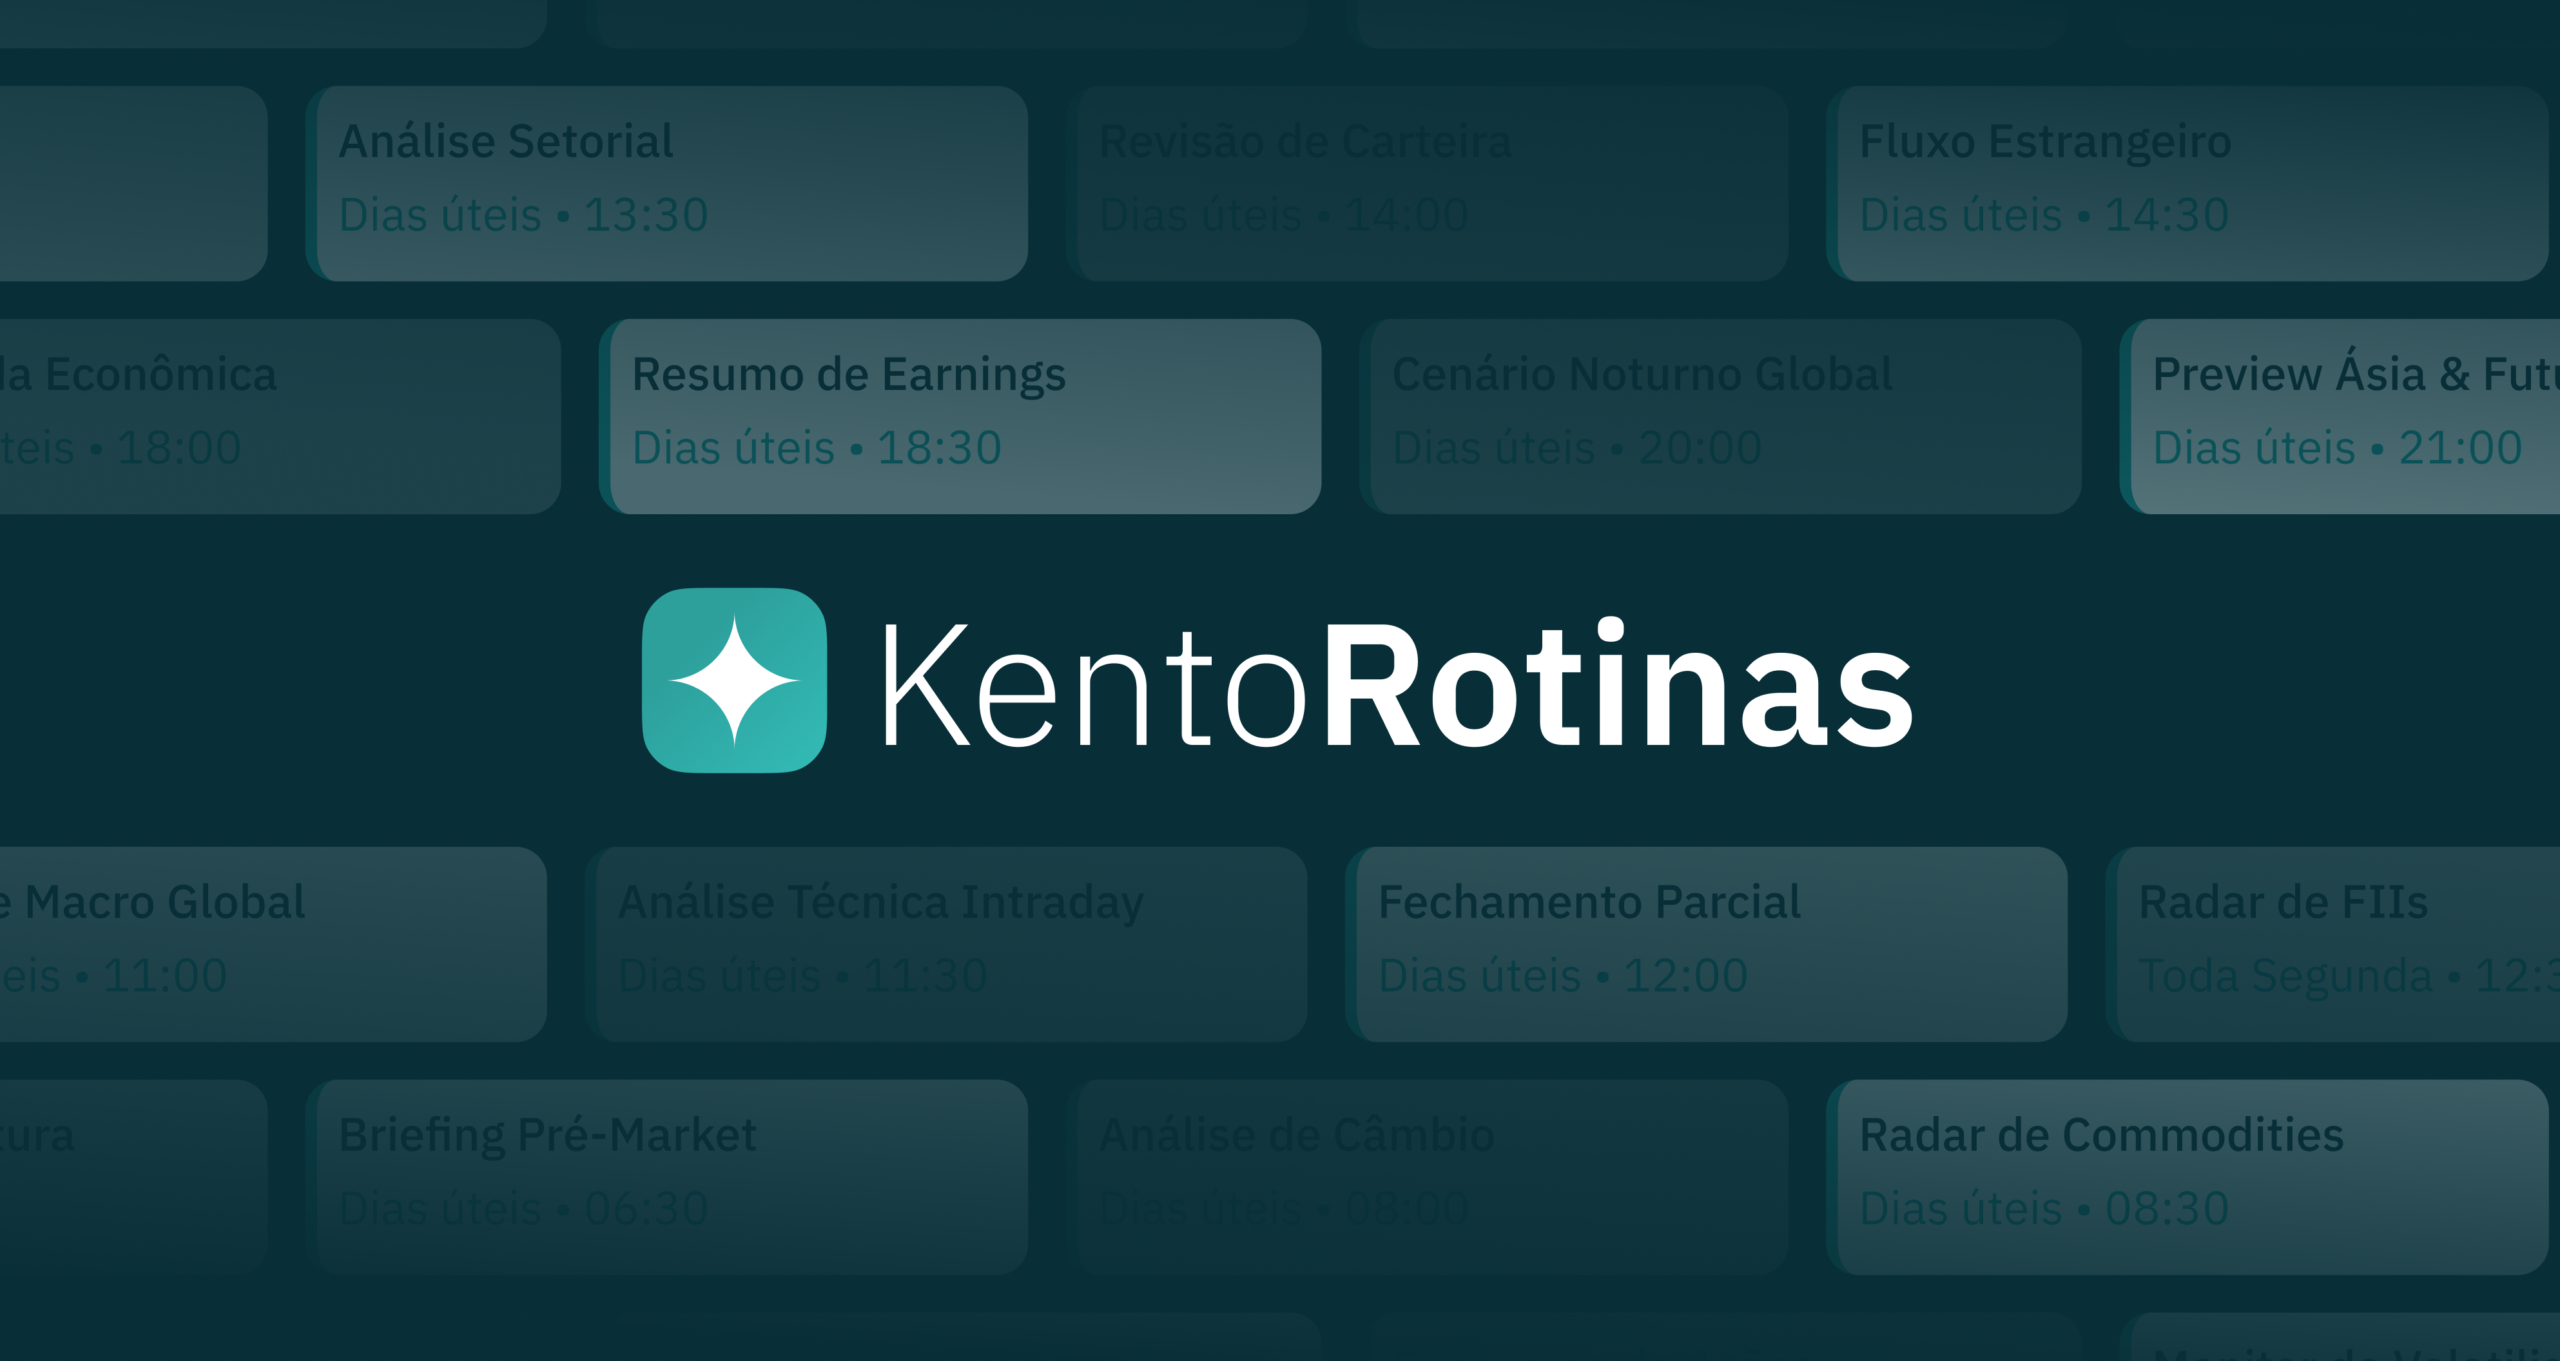
Kento Routines turn recurring financial research into scheduled briefings delivered through chat, email, WhatsApp or Telegram.
See how Economatica data and tools support research, decisions and daily work across your team.
Choose where to log in